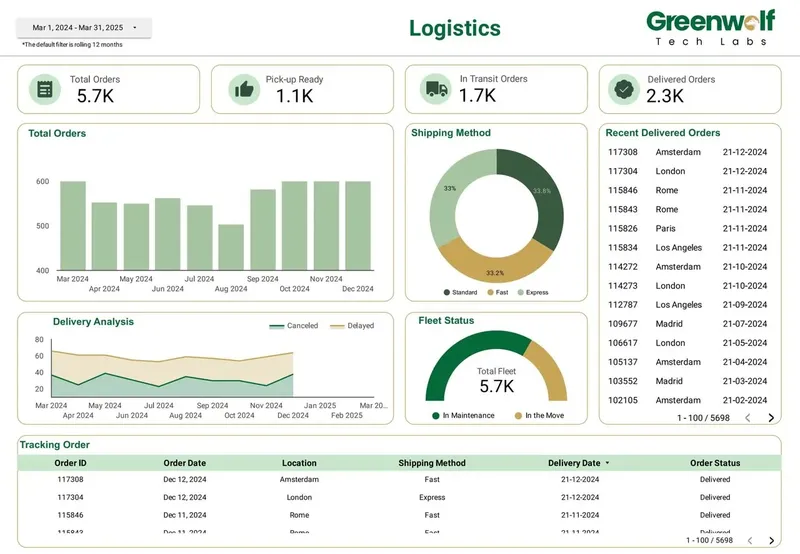
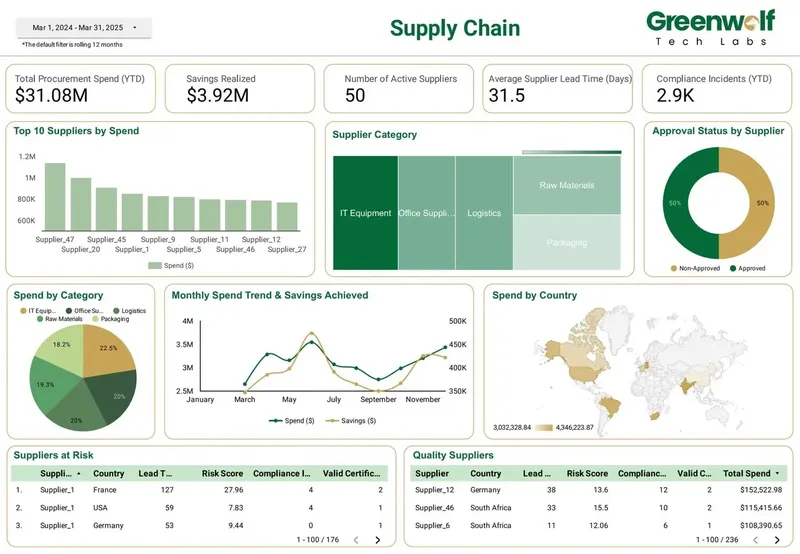
Dashboards and reporting pipelines our team has delivered. Screens are shown with sample data; client names are withheld.
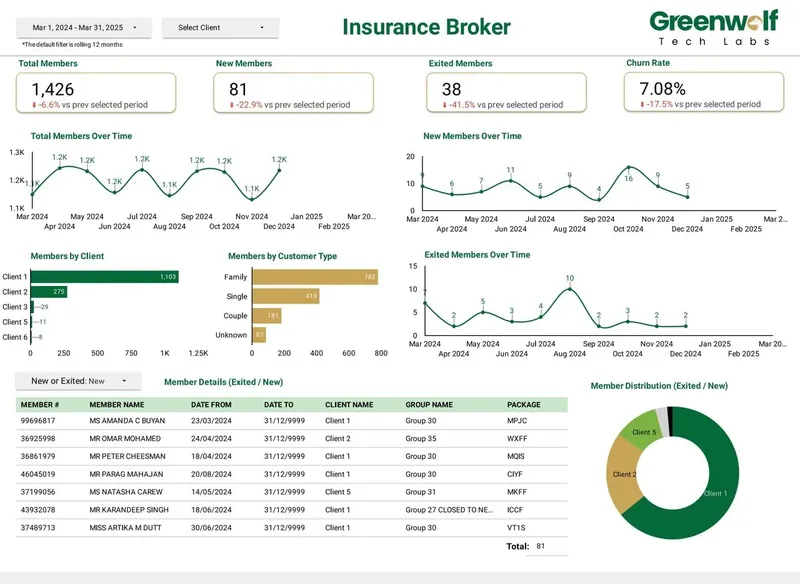
Insurance broker dashboard built in Data Studio (sample data)
Case study · Insurance brokerage, Australia
From 4-5 hours of spreadsheet work to a report in under 5 minutes
Monthly reports were assembled by hand from inconsistent .xls files sent by several insurers. The files now land in Google Drive, are mapped into one central sheet with the business rules applied, and feed a Data Studio dashboard.
Report time: 4-5 hours to under 5 minutes
Reporting accuracy: about 75% to 99%
Visibility across insurers: limited to real time, with filters
Members joined, exited and retained per client scheme, with churn by customer type.
Refreshed from the policy administration export instead of being rebuilt in a spreadsheet every month, with a filterable member list behind every chart.
We also build CFO dashboards that put cash, revenue, spend and margin on one page for finance leaders, and multi-channel marketing dashboards that join Google Ads, Meta, LinkedIn, GA4 and Search Console into one view of spend, leads and return. These are shown on request, because they contain client figures.
Selected organisations
.
Get started
Tell us what your reporting has to do
Describe the dashboards you need, who reads them and where the data sits. We reply within one business day with an approach, the connectors involved and a fixed-price plan.