
Marketing dashboards
A Data Studio marketing dashboard for every channel you pay for
We build a Data Studio marketing dashboard that brings paid, organic and CRM data into one report, so marketing leaders can see spend, leads and pipeline by channel without opening six ad platforms. It is for in-house marketing teams and growth leads who need one set of numbers the whole company agrees on.

Quick answer
What should a Data Studio marketing dashboard include?
A Data Studio marketing dashboard should show spend, conversions and cost per acquisition for every paid channel side by side, plus website behavior from GA4, organic search from Search Console, and leads and pipeline from the CRM. The key is one blended CPA and one definition of a lead across all sources.
- Every paid channel is mapped to one shared set of field names before any charts.
- Blended CPA and pipeline by channel replace six separate platform logins.
- CRM data closes the loop from ad click to qualified opportunity.
- Large accounts move to BigQuery to avoid GA4 quota errors and slow pages.
What goes into a multi-channel Data Studio marketing dashboard?
It combines ad spend, site behavior, organic search and CRM outcomes in one place. Our marketing builds usually pull from Google Ads, Meta, LinkedIn and TikTok for paid media, GA4 for sessions and key events, Search Console for queries and clicks, and HubSpot, Salesforce or a CRM export for leads and deals.
Each platform names things differently: Meta calls it amount spent, Google Ads calls it cost, LinkedIn calls it total spent. Before any chart is built, we map every source to one shared schema (date, channel, campaign, spend, impressions, clicks, conversions) so totals add up and filters work across all of them.
- Paid media: Google Ads, Meta, LinkedIn, TikTok.
- Web and search: GA4, Search Console.
- Outcomes: CRM leads, opportunities, closed revenue.
How do you calculate blended CPA across channels?
Blended CPA is total spend across every paid channel divided by total conversions from one agreed source of truth. The hard part is choosing that source, since each ad platform claims credit for the same lead.
We usually take spend from the ad platforms and conversions from the CRM or GA4, never from the ad platforms themselves, so a lead is counted once. Platform-reported conversions stay on the channel pages for optimization, clearly labeled, while the summary page uses the deduplicated figure. A calculated field with SUM(spend) / SUM(conversions) at the right aggregation level avoids the classic mistake of averaging per-row CPAs.
What you get
What we build
Scoped and quoted at a fixed price after a free review.
Channel mapping
A shared schema that renames each platform's fields so spend and conversions line up across sources.
Summary page
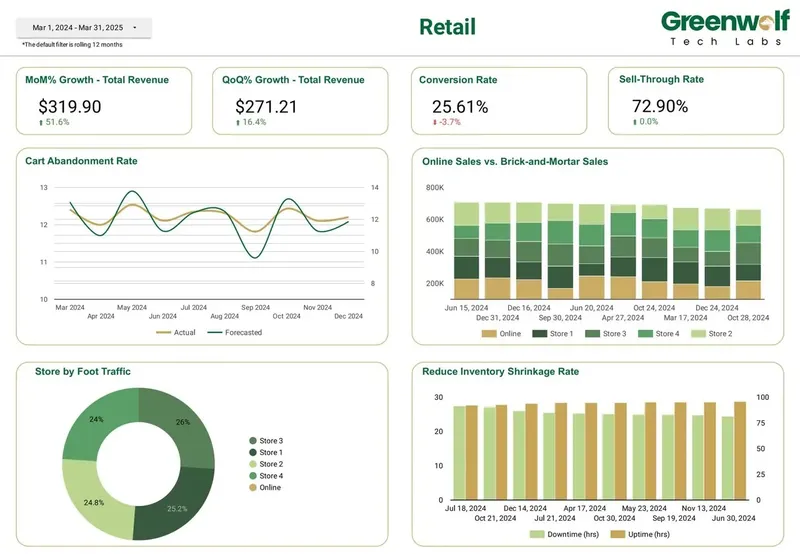
Spend, leads, blended CPA, pipeline and revenue against target and prior period.
Channel pages
One drill-down page per paid channel, plus GA4 and Search Console views.
Pipeline view
CRM opportunities and revenue traced back to channel and campaign through UTM data.
Connector setup
Native and partner connectors configured, or a BigQuery layer where volume requires it.
Field guide
Plain definitions of every metric, including how blended CPA is calculated.
How do you connect ad spend to pipeline and revenue?
We join CRM records to campaigns through UTM parameters captured on the lead form. When source, medium and campaign are stored on the contact, each opportunity can be traced back to a channel and a campaign.
That turns the dashboard from a traffic report into a pipeline report: cost per qualified lead, pipeline value by channel, and revenue per dollar spent. Where UTM capture is missing or inconsistent, we tell you during the review, because no dashboard can fix attribution data that was never recorded.
Should marketing data go through blends or BigQuery?
Small accounts can run on blends; larger ones should land in BigQuery. A blend joins at most 5 data sources with equality joins only, and every chart re-queries every source, which slows pages and burns API quota.
GA4 is the common bottleneck. The standard Data API quota is 14,000 tokens per project per property per hour, and a dashboard with many charts and many viewers hits it quickly. When we see quota errors or a report taking more than a few seconds per page, we load channel data into partitioned BigQuery tables through a partner connector or export, and point the dashboard at one tidy table.
Which partner connectors do you use for Meta, LinkedIn and TikTok?
Google's native connectors cover Google Ads, GA4, Search Console and YouTube. For Meta, LinkedIn, TikTok and most CRMs we use partner connectors such as Supermetrics, Windsor.ai, Porter Metrics, Funnel, Power My Analytics or Catchr.
The right choice depends on how many accounts you run and whether the data goes straight into Data Studio or into BigQuery first. Vendor pricing changes, so we compare current options with you rather than quoting them here.
What does a marketing leader see on the summary page?
One page answers whether marketing is working this month: spend, leads, blended CPA, pipeline and revenue, each against target and the previous period. Below that sits a channel table with the same metrics per channel, so a weak channel stands out without scrolling.
Drill-down pages follow for each channel, then a campaign table with filters for date, channel and region. A parameter lets the team change the target CPA without editing any chart, and scheduled email delivery sends the summary to leadership every Monday.
Why do marketing dashboards lose the team's trust?
Most lose trust because two people get two different numbers for the same thing. A paid social manager quotes Meta's conversions, the sales team quotes the CRM, and the dashboard shows a third figure nobody can explain.
We prevent that in three ways. First, every metric has one written definition and one source, shown in an info icon next to the chart. Second, campaign naming rules are agreed before launch, so a CASE statement can sort campaigns into brand, non-brand, prospecting and retargeting reliably. Third, a reconciliation page compares dashboard totals with each platform for the last closed month, so differences are explained before anyone asks.
Broken connectors are the other trust killer. Data Studio does not warn anyone when a source stops refreshing, so we add a freshness check that shows the latest date loaded for each channel at the top of the summary page.
How it works
How a project runs
- 01
Free review
We check your channels, CRM and UTM capture, and agree what counts as a lead.
- 02
Data mapping
We connect every source and map it to one schema.
- 03
Build
We build the summary and channel pages and share drafts for feedback.
- 04
Reconcile
A second analyst checks dashboard totals against each ad platform and the CRM.
- 05
Launch
We set schedules and access, then walk your team through the report.
FAQ
Frequently asked questions
Can Data Studio combine Google Ads and Meta Ads data?
Yes. Google Ads connects natively, and Meta needs a partner connector such as Supermetrics, Windsor.ai or Porter Metrics. We map both to one schema so spend and conversions can sit in the same table.
Why do my Data Studio totals not match Google Ads or Meta?
Usually because of different attribution windows, time zones, or conversions counted by both platforms. We document which source each number comes from and use one deduplicated conversion count on the summary page.
How do I stop GA4 quota errors in a marketing dashboard?
Reduce the number of GA4 charts per page, use an extract for historical data, or move GA4 data into BigQuery. The standard GA4 Data API limit is 14,000 tokens per project per property per hour, and busy reports hit it.
Can the dashboard show leads and revenue from our CRM?
Yes, if UTM source, medium and campaign are captured on each lead. We connect HubSpot, Salesforce or a CRM export and join opportunities to campaigns, so you can see pipeline by channel.
Can a Data Studio marketing dashboard track organic search?
Yes. Search Console connects natively and shows queries, pages, clicks, impressions and average position. We place it next to GA4 landing page data so organic traffic can be tied to leads.
How much does a Data Studio marketing dashboard cost?
We quote a fixed price after a free review, based on the number of channels, accounts and whether a BigQuery layer is needed. Partner connector fees are paid separately to the vendor.
Do you build marketing dashboards for agencies' clients?
Yes. Agencies usually take our white label service, which adds a master template, client branding and a rollout process across the client roster.
Keep reading
Related pages
Get started
Tell us what your reporting has to do
Describe the dashboards you need, who reads them and where the data sits. We reply within one business day with an approach, the connectors involved and a fixed-price plan.
- Free 30-minute reporting review
- Fixed quote before any work starts
- Everything built and owned in your Google account
Prefer email? info@greenwolftechlabs.com
Get a free proposal
Two lines is enough to start.