
Logistics
Data Studio logistics dashboards for freight and fulfillment teams
A logistics dashboard in Data Studio shows every order's stage, every delayed or cancelled shipment and the state of your fleet without anyone stitching together TMS, WMS and carrier portal exports by hand. We build them for 3PLs, freight forwarders, distributors and in-house fulfillment teams. Operations gets a live control view, and management gets on-time performance and exceptions it can trust.
Quick answer
What should a logistics dashboard track?
A logistics dashboard should track orders by stage (pickup ready, in transit, delivered), the shipping method mix, delayed and cancelled deliveries with their reasons, fleet status, and an order tracking table that operations can search. With promised dates and quantities in the data, it can also report OTIF, the share of orders delivered on time and in full.
- Our logistics build shows orders by stage, shipping method mix, delays, cancellations and fleet status.
- TMS, WMS and carrier portal exports are mapped to one order ID and one status list.
- OTIF needs promised date and ordered quantity captured at order creation, not reconstructed later.
- An order tracking table lets customer service answer where-is-my-order questions in seconds.
What does a logistics dashboard look like in practice?
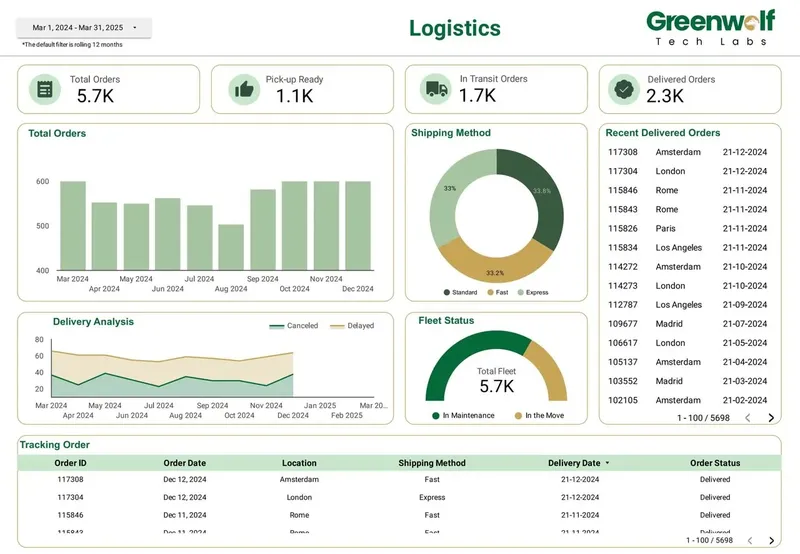
It looks like an operations board that updates itself. The logistics dashboard we built in Data Studio opens with order counts by stage, pickup ready, in transit and delivered, so a shift lead sees the pipeline at a glance.
Below that sit the shipping method mix, a delivery analysis that separates cancelled from delayed orders, a fleet status panel and an order tracking table. The table is filterable by customer, lane, carrier and date, so customer service can look up a consignment without logging into three portals. Every view reads from one status model, so the count of in-transit orders on the overview always matches the rows in the table.
How do TMS, WMS and carrier portal data fit together?
Through one order key and one status vocabulary. A warehouse management system knows when an order was picked, packed and staged. A transport management system knows the load, route and vehicle. Carrier portals know the scan events after handover. Each uses its own status names and often its own reference number, and a single order may split into several shipments or consolidate into one load.
We build a mapping that translates every source status into a short shared list, using a CASE statement in a calculated field or, for larger volumes, a view in BigQuery. A cross-reference table links your order number to the carrier's tracking number and the TMS load ID.
Exports arrive in many forms: scheduled CSV emails, SFTP drops, API pulls, or someone downloading from a portal each morning. We automate what can be automated and give the rest a single Google Drive folder with a fixed naming rule, so the pipeline knows where to look.
What you get
What we build
Scoped and quoted at a fixed price after a free review.
Order pipeline view
Orders by stage, pickup ready, in transit and delivered, with lane, customer and date filters.
Shipping method mix
Share of orders by service level and carrier, with cost per order where your data carries it.
Delivery analysis
Delayed and cancelled orders broken down by reason code, carrier, lane and customer.
OTIF page
On-time and in-full rates shown separately and combined, using rules agreed with your team.
Fleet status panel
Vehicles by status next to waiting pickups, from telematics, maintenance logs or a status sheet.
Order tracking table
A searchable list of every order with its latest stage, carrier reference and expected delivery.
Status mapping layer
One shared status list and an order-to-carrier cross-reference that every page reads from.
How is OTIF measured, and why do teams disagree on it?
OTIF is the share of orders delivered on or before the promised date and with the full ordered quantity. Disagreement comes from which date counts as promised (customer requested, confirmed or rescheduled), whether a delivery window or a single day applies, and whether a short shipment later completed still counts.
We agree those rules with you, encode them once and show both components separately. On time and in full each get their own rate, because a team fixing late dispatch needs different actions from a team fixing pick accuracy. If your systems do not store the original promised date, we start capturing it so the measure is honest from that point forward.
Why give delays and cancellations their own page?
Because they are the exceptions that cost money, and they hide inside averages. A delivered rate of most orders can look healthy while one lane or carrier carries most of the delays.
The delivery analysis page splits cancelled from delayed orders and breaks each down by reason code, carrier, lane, customer and day of week. Reason codes are the weak point in most operations data, so we map free text and inconsistent codes into a short list and keep an unmapped bucket visible, so it shrinks over time instead of being ignored.
- Delayed orders by reason, carrier and lane.
- Cancelled orders by stage at cancellation and by customer.
- Trend lines so you can see whether a fix is working week by week.
How fresh can a logistics report be?
As fresh as the slowest source you need on that page. Carrier scans and TMS events can land many times a day, while some portal exports are daily. We set each page's refresh to match and label the last update time, so dispatch never acts on stale data.
Viewers can trigger a manual refresh, and Data Studio Pro supports hourly scheduled delivery to email, Slack or Google Chat, useful for a morning exceptions list sent to the operations channel. High-volume event data goes into BigQuery, partitioned by date, so pages filter fast even with years of shipments behind them.
What does fleet status add for teams running their own vehicles?
It shows which vehicles are available, on route, in maintenance or idle, next to the work waiting for them. For carriers and distributors with their own fleet, that view helps planners match capacity to tomorrow's pickups.
Fleet data can come from a telematics export, a maintenance log or a simple status sheet the transport office updates. We start with what you have, and add utilization, kilometers per vehicle and maintenance due dates as the data allows. As a data studio agency, we would rather ship a fleet panel fed by a reliable sheet than wait months for an integration. Teams moving from an older Looker Studio report keep their links, because those reports moved to Data Studio automatically.
How it works
How a project runs
- 01
Free review
We look at your TMS, WMS and carrier exports and the reports you run today, then quote a fixed price.
- 02
Map statuses and keys
We agree one status list and build the cross-reference between order, load and tracking numbers.
- 03
Automate feeds
Scheduled exports, API pulls or a Drive folder bring each source in without manual copying.
- 04
Build and reconcile
Pages are built and order counts reconciled against your systems for a sample week.
- 05
Go live
Exception alerts and scheduled summaries are switched on, and the operations team is trained.
FAQ
Frequently asked questions
Can Data Studio connect to a TMS or WMS?
Usually through an export rather than a native connector. If the system writes to a SQL database Data Studio supports, such as MySQL, PostgreSQL or SQL Server, we can connect directly. Otherwise scheduled CSV or API exports go into BigQuery or Google Sheets.
What is OTIF in logistics?
OTIF stands for on time in full. It is the percentage of orders delivered by the promised date with the complete ordered quantity. Teams should agree which promised date counts before measuring it.
How do you track delayed shipments in a dashboard?
Each order's actual delivery is compared with its promised date, and late orders are grouped by reason, carrier and lane. A trend line shows whether delays are rising or falling. Unmapped reasons stay visible so they get fixed.
Can customers see their own shipments?
Yes. A customer-facing version can filter the data source by viewer email so each customer sees only their orders. Internal costs and other customers' data are excluded from that version.
How often can the order tracking table update?
It updates as often as the underlying exports arrive, and viewers can refresh manually. Many teams load carrier events several times a day and warehouse data at shift change.
Keep reading
Related pages
Get started
Tell us what your reporting has to do
Describe the dashboards you need, who reads them and where the data sits. We reply within one business day with an approach, the connectors involved and a fixed-price plan.
- Free 30-minute reporting review
- Fixed quote before any work starts
- Everything built and owned in your Google account
Prefer email? info@greenwolftechlabs.com
Get a free proposal
Two lines is enough to start.