
Supply chain and procurement
Data Studio procurement dashboards for supply chain teams
A procurement dashboard in Data Studio gives a CPO or head of supply chain total spend, savings realized, supplier lead times and supplier risk in one report built from ERP and procure-to-pay exports. We build them for procurement and supply chain teams in mid-size companies whose spend data is spread across purchase orders, invoices and a supplier list nobody fully trusts. You get one spend view, defined once, that category managers and finance both accept.
Quick answer
What should a procurement dashboard include?
A procurement dashboard should include total procurement spend, savings realized, active suppliers, average supplier lead time, compliance incidents, top suppliers by spend, spend by category and by country, suppliers at risk and approval status. Those measures cover cost, supplier performance and process control, the three things a procurement leader reports to the CFO.
- Our procurement build covers spend, savings, active suppliers, lead time, incidents, risk and approvals.
- PO, invoice and supplier master exports are cleaned into one spend table before charting.
- Savings realized needs an agreed baseline, and we show the method on the page.
- Spend by country needs one reporting currency and a dated exchange rate table.
What does our procurement dashboard show leadership?
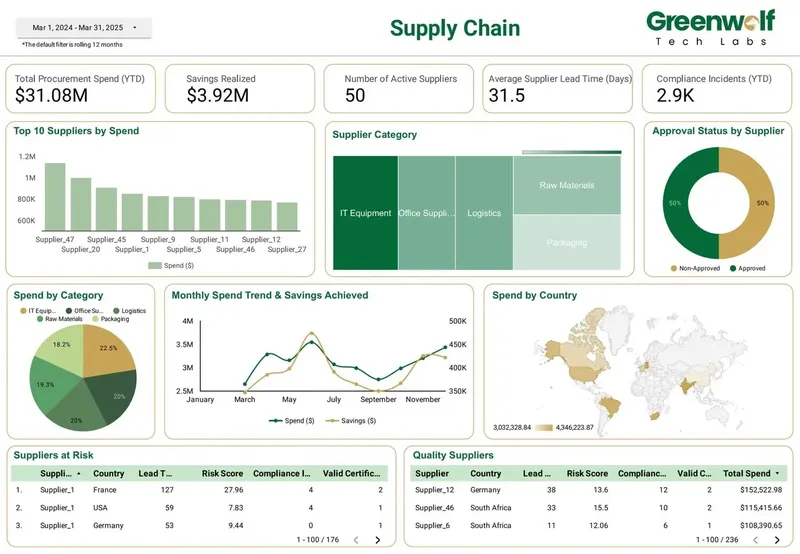
A one-page view of spend, savings and supplier health, with detail a click away. The procurement dashboard we built in Data Studio opens with total procurement spend, savings realized, active suppliers and average supplier lead time as headline figures.
Beneath them sit top suppliers by spend, spend by category and by country, a list of suppliers at risk, compliance incidents and approval status for open requisitions and purchase orders. Every chart shares the same date, category and business unit filters. Category managers can open the report already filtered to their categories, and finance can switch between committed spend from purchase orders and actual spend from invoices with a single control.
Which ERP and P2P exports does a spend report need?
Three core extracts, plus whatever risk data you hold. Purchase order lines give committed spend, category, buyer and requested dates. Invoice lines give actual spend and payment terms. The supplier master gives names, countries, status and parent company. These usually come from the ERP and from a procure-to-pay or sourcing suite such as SAP Ariba or Coupa, exported on a schedule.
The cleanup matters more than the charts. Supplier names are duplicated with small spelling differences, categories are coded inconsistently, and some spend arrives without a PO at all. We normalize suppliers to a parent, map spend to your category taxonomy and keep a non-PO spend flag, then load the result into BigQuery. Data Studio blends cannot do this; they join at most five sources on exact matches.
What you get
What we build
Scoped and quoted at a fixed price after a free review.
Spend overview
Total procurement spend, savings realized, active suppliers and average lead time, with date and business unit filters.
Spend cube pages
Spend by category, by country and by supplier, with top suppliers ranked and non-PO spend flagged.
Savings tracker
Negotiated versus realized savings by category, with the baseline method shown on the page.
Supplier performance
Lead time average and spread per supplier, plus concentration by category.
Supplier risk list
Suppliers flagged at risk, each with the rule that triggered the flag.
Compliance and approvals
Compliance incidents by severity and open requisitions and POs by approval stage and age.
Clean spend table
Normalized suppliers, mapped categories and converted currency in BigQuery, ready for any report.
How is savings realized calculated?
As the difference between a baseline price and the price actually paid, multiplied by the volume bought at the new price. The argument is always about the baseline: last price paid, average of the last year, the first quote, or the budget.
We agree the method with procurement and finance, store negotiated savings separately from realized savings, and show the method on the page. Realized savings then come from invoice lines, not from the negotiation tracker, so the number is something the CFO can trace. Cost avoidance, such as a price increase that was refused, is tracked separately and never added to realized savings.
How do lead time and supplier risk show up?
Lead time is the gap between PO date and goods receipt, averaged per supplier and category. We show the average and the spread, because a supplier with a good average and wild variation still forces you to hold safety stock.
Suppliers at risk are flagged by rules you choose, for example single-source categories, lead time drift, open compliance incidents, a high share of spend with one supplier, or an external risk score if you subscribe to one. Each flag is a calculated field, so the list explains why a supplier is on it.
- Average and spread of lead time by supplier and category.
- Concentration: share of category spend with the top supplier.
- Open compliance incidents and their age.
- Suppliers flagged at risk, with the rule that triggered each flag.
Where do compliance incidents and approvals fit in a procurement dashboard?
They show whether the process is being followed, which is half of what procurement is accountable for. Compliance incidents, such as purchases outside contract, missing documentation or supplier audit findings, are logged with date, supplier and severity and shown as a trend.
Approval status lists requisitions and POs by stage, pending, approved or rejected, with how long each has waited. Long approval queues often explain lead time problems that look like supplier issues. Splitting lead time into internal approval days and supplier days shows which side of the gap needs attention, and approvers can be ranked by average wait so bottlenecks are named, not guessed.
How do you handle multiple currencies and countries?
With one reporting currency and a dated exchange rate table. Spend by country only makes sense if a euro invoice and a rupee invoice are converted at a known rate for the right month. We keep the rate table in BigQuery or a Google Sheet, show which rate applied, and let viewers switch between local and reporting currency with a parameter.
As a data studio agency with offices in India and the USA, we are used to spend that crosses borders. Scheduled delivery sends the monthly spend pack to leadership, and reports built in the Looker Studio years carry over unchanged, so you can extend what exists.
How it works
How a project runs
- 01
Free review
We look at your PO, invoice and supplier exports and current reports, then quote a fixed price.
- 02
Taxonomy and rules
We agree category mapping, savings baseline, risk rules and currency handling with procurement and finance.
- 03
Clean and load
Supplier normalization, category mapping and scheduled loads into BigQuery.
- 04
Build and reconcile
Pages are built and total spend reconciled against your ERP for a closed period.
- 05
Handover
Category managers are trained, and the mapping sheets are handed to an owner on your team.
FAQ
Frequently asked questions
Can Data Studio connect to SAP Ariba or Coupa?
Not with a native connector. We schedule exports or API extracts from the P2P suite into BigQuery, and the report reads from there. This also lets us join P2P data with ERP invoices.
How do you calculate savings realized in procurement?
Savings realized is the baseline price minus the price paid, times the quantity bought at the new price, taken from invoice lines. The baseline method is agreed with finance and shown on the dashboard.
What is a spend cube?
A spend cube is spend analyzed by three dimensions at once, usually category, supplier and business unit or country. In Data Studio it becomes a set of linked pages and filters on one clean spend table.
How do you identify suppliers at risk?
We apply rules you choose, such as single sourcing, lead time drift, open compliance incidents or spend concentration. Each flagged supplier shows which rule triggered it, so the list is easy to act on.
How do you deal with duplicate supplier names?
We normalize names and group related entities under a parent supplier in a mapping table. Your team can review and edit the mapping, and new suppliers are flagged for a quick check.
Can the procurement report show spend in local currency?
Yes. A parameter lets viewers switch between local and reporting currency. Rates come from a dated table, so every converted figure can be traced.
Keep reading
Related pages
Get started
Tell us what your reporting has to do
Describe the dashboards you need, who reads them and where the data sits. We reply within one business day with an approach, the connectors involved and a fixed-price plan.
- Free 30-minute reporting review
- Fixed quote before any work starts
- Everything built and owned in your Google account
Prefer email? info@greenwolftechlabs.com
Get a free proposal
Two lines is enough to start.