
Ecommerce and retail
Data Studio retail dashboards for stores and online channels
A retail dashboard in Data Studio puts Shopify or WooCommerce orders, Amazon Seller Central sales, point-of-sale takings and store footfall on one page that refreshes on its own. We build them for multi-channel retailers and ecommerce brands whose merchandising, ecommerce and store teams each keep a different spreadsheet. You get one definition of revenue, conversion and sell-through, and a report every team can filter to its own stores and channels.
Quick answer
What should a retail dashboard show?
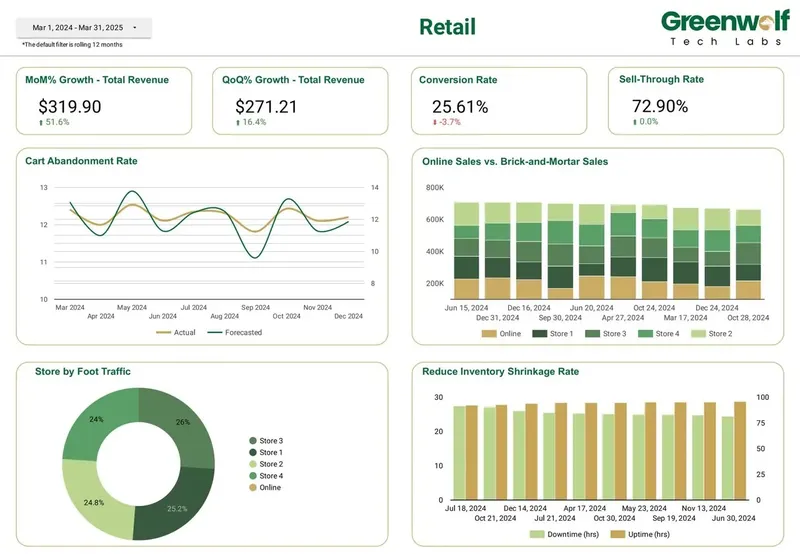
A retail dashboard should show month-on-month and quarter-on-quarter revenue growth, conversion rate, sell-through rate, cart abandonment against forecast, online versus in-store sales, store foot traffic and inventory shrinkage. Together those views answer the weekly trading questions: what sold, where it sold, through which channel, and what went missing from stock before it could sell.
- Our retail build covers growth, conversion, sell-through, cart abandonment, channel split, footfall and shrinkage.
- Shopify, WooCommerce, Amazon Seller Central, Square or Lightspeed and footfall counters feed one model.
- Store conversion uses footfall counts as the denominator, so busy stores are judged fairly.
- Large SKU-level data moves to BigQuery so pages stay fast during trading reviews.
What does our Data Studio retail dashboard show?
It shows trading performance across every channel on one set of pages. The retail dashboard we built in Data Studio opens with revenue growth month on month and quarter on quarter, then breaks performance into the measures a head of retail reviews every Monday.
Each view is filterable by store, region, channel and category, and every chart reads from the same blended model, so a number on the overview always matches the number on the detail page.
- MoM and QoQ revenue growth, with the prior period shown alongside.
- Conversion rate for the web store and, using footfall, for physical stores.
- Sell-through rate by category and season.
- Cart abandonment tracked against the forecast you set for it.
- Online versus in-store sales, side by side and as a share of total.
- Store foot traffic by day and hour.
- Inventory shrinkage by store and category.
Where does retail data come from, and how do we join it?
Most retailers run three to five systems that were never meant to talk to each other. Online orders sit in Shopify or WooCommerce, marketplace sales in Amazon Seller Central, till transactions in a POS such as Square or Lightspeed, and door counts in a footfall counter vendor's portal or a CSV it emails each morning.
None of those is a native Data Studio connector, so we bring them in through a partner connector such as Windsor.ai or Supermetrics, or load them into BigQuery on a schedule. Store and SKU mapping tables live in a Google Sheet your team can edit, which matters the day a new store opens or a product is renamed on Amazon but not on Shopify.
We avoid stacking everything into one blend. Data Studio blends take at most five sources and only equality joins, so a retail model with a product master, store master, three sales feeds and footfall needs to be joined upstream, usually in BigQuery. That upstream modeling is most of the work a data studio agency does for a retailer, and it is what keeps the report fast once a second season of SKUs arrives.
What you get
What we build
Scoped and quoted at a fixed price after a free review.
Trading overview
MoM and QoQ revenue growth across all channels, with store, region and category filters.
Channel split page
Online versus in-store sales with click-and-collect, marketplace and returns rules written into calculated fields.
Conversion and cart abandonment
Web conversion and cart abandonment against forecast, plus store conversion using footfall as the denominator.
Sell-through by category
Units sold against units received by category and season, so markdown decisions start from one agreed number.
Store footfall view
Foot traffic by store, day and hour from your counter data, set next to transactions.
Shrinkage tracker
Book versus counted stock by store and category, with the stocktake date shown on every figure.
Definitions page
Every metric, formula and channel rule written in plain English inside the report.
How do you compare online and in-store sales fairly?
You agree the rules first, then encode them once. Online and store revenue look comparable until you ask where a click-and-collect order belongs, whether Amazon fees come off before or after the comparison, and which date a return lands on.
We write those decisions into calculated fields, usually a CASE statement that assigns every order to a channel, and document them on a definitions page inside the report. When finance asks why the channel split differs from last year's deck, the answer is on the page rather than in someone's inbox.
Tax and currency get the same treatment. A retailer selling in several countries needs net sales in one reporting currency, and the conversion rate used for each day should be visible, not buried in a formula.
Why do sell-through and shrinkage disagree between teams?
Usually because each team is dividing by a different stock figure. Merchandising may calculate sell-through as units sold over units received, while stores use units sold over opening stock, and both are reasonable until they share a slide.
Shrinkage has a timing problem too. It comes from the gap between book stock and counted stock, so it only moves when a stocktake or cycle count is posted. We show the count date next to every shrinkage figure so nobody reads a quiet month as a good one.
Our job is to pick one definition with you, label it clearly and keep the alternative available as a parameter where a team genuinely needs it.
What makes a retail dashboard slow, and how do we fix it?
Row volume and live API calls. A model at SKU, store and day level grows fast, and Data Studio returns too many rows errors on large queries. We aggregate to the grain each page needs and partition BigQuery tables by date so a date filter scans only the days it shows.
If cart abandonment comes from GA4 events, the GA4 Data API quota of 14,000 tokens per project per property per hour can run out when many people open a busy report. An extract or a daily GA4 export to BigQuery avoids those quota errors.
We also set data source credentials deliberately. Owner's credentials let store managers see the report without access to Shopify or the POS back office, and we keep the owning account on a shared service login so the report does not break when someone leaves.
Who on a retail team uses which page?
Each role gets a starting view rather than a separate report. Store managers open the store page already filtered to their location, merchandisers start on sell-through by category, the ecommerce lead checks conversion and cart abandonment, and finance takes the channel split.
Scheduled delivery sends a PDF of the trading summary to leadership every Monday. On Data Studio Pro, schedules can run hourly and deliver to Slack or Google Chat, which suits peak trading weeks. Reports built under the old name, Looker Studio, carry over unchanged, so an existing store report can be extended rather than rebuilt.
How it works
How a project runs
- 01
Free review
We look at your current reports and systems and agree which questions the dashboard must answer. You get a fixed price.
- 02
Data mapping
We connect Shopify, Amazon, POS and footfall sources and build store and SKU mapping tables your team can maintain.
- 03
Definitions workshop
One session with merchandising, ecommerce and finance to settle channel, sell-through and shrinkage rules.
- 04
Build and test
We build the pages, reconcile totals against your POS and ecommerce back office, and fix any gaps.
- 05
Handover
Training for each team, scheduled delivery set up and a written guide to keep mapping tables current.
FAQ
Frequently asked questions
Can Data Studio connect to Shopify and Amazon Seller Central?
Not natively, but partner connectors such as Windsor.ai and Supermetrics bring both in, and either can also be loaded into BigQuery. We choose based on data volume and how often you need it refreshed. For larger catalogs, BigQuery usually gives faster pages.
How do you measure in-store conversion rate?
In-store conversion is transactions divided by footfall for the same store and period. It needs a door counter feed and a POS feed that share store IDs and time buckets. We build the mapping so both line up by store and hour.
What is a good sell-through rate definition for a dashboard?
The most common version is units sold divided by units received over a period, expressed as a percentage. Some teams use opening stock instead. We help you choose one, label it on the page and keep the other available as a parameter if needed.
Can store managers see only their own store?
Yes. Each manager can open a link with their store pre-filtered, or the data source can filter rows by the viewer's email so each person sees only their locations. We pick the approach that suits how strictly you need access separated.
Will our existing Looker Studio retail report still work?
Yes. Reports moved to Data Studio automatically when Google renamed the product in April 2026, and old links redirect. We can extend the report you already have rather than starting over.
How often can retail reports refresh in Data Studio?
It depends on the source and connector. Many retailers refresh sales daily and footfall overnight. With Data Studio Pro, scheduled delivery can run hourly, which helps during peak trading.
Keep reading
Related pages
Get started
Tell us what your reporting has to do
Describe the dashboards you need, who reads them and where the data sits. We reply within one business day with an approach, the connectors involved and a fixed-price plan.
- Free 30-minute reporting review
- Fixed quote before any work starts
- Everything built and owned in your Google account
Prefer email? info@greenwolftechlabs.com
Get a free proposal
Two lines is enough to start.