
Examples
Data Studio dashboard examples: eight real builds and the data behind them
The most useful Data Studio dashboard examples are the ones built on real business data, not demo accounts: an insurance churn view, a pharma brand tracker, a plant production board, a logistics order tracker. This guide walks through eight dashboard types our team at Greenwolf Tech Labs has built in Data Studio, the metrics on each page, the sources behind them and the data work that made them reliable. Use it to brief your own build or to judge whether a template will do.
Quick answer
What are good examples of Data Studio dashboards?
Good Data Studio dashboard examples answer one team's recurring question on one screen: churn by client for an insurance broker, Rx volume against forecast for a pharma brand, units lost per machine for a plant, orders by stage for a logistics team, or spend by supplier for procurement. Each needs clean source data and defined metrics before any chart is drawn.
- Most public Data Studio examples are marketing templates built on Google's demo GA4 account.
- Operational dashboards for insurance, manufacturing or logistics usually start from exports and spreadsheets, not APIs.
- The data preparation behind an example matters more than its layout or colours.
- Use a template for single-source marketing reports and a custom build for multi-source operations.
Why most Data Studio dashboard examples online look the same
Search for Data Studio dashboard examples and you will mostly find template galleries. Coupler.io's roundup, updated in November 2026, lists 63 templates across PPC, marketing, email, social, SEO, CRM, ecommerce, finance and project management. Directive Consulting's list of 14 examples, published in 2020, is largely public Google Analytics demo reports. Both are useful if you run a marketing team with standard connectors.
What they do not show is the work most companies actually struggle with: operational reporting from systems that have no tidy connector. A policy administration export, a production log kept by shift, a carrier status file or a supplier master in a spreadsheet. Those are the dashboards that save the most hours, and they are the ones a template cannot give you.
The examples below come from builds our team has delivered in Data Studio (formerly Looker Studio, renamed back to Data Studio in April 2026). We describe the pages and metrics, plus where the data came from and what had to happen to it first. Client names and figures stay private.
Insurance broker example: membership and churn by client scheme
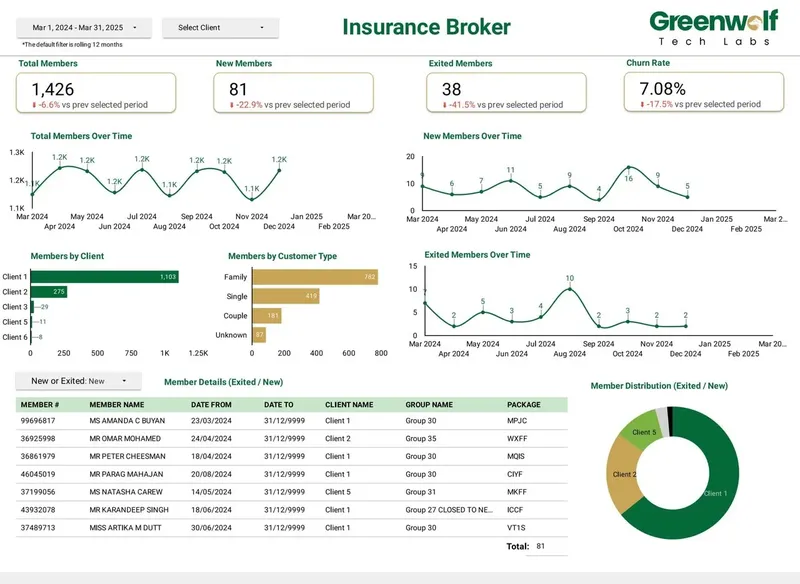
An insurance broker needed to see members joined, exited and retained, and churn rate by client and by customer type, with a filterable member list underneath. Before the dashboard, someone rebuilt this in a spreadsheet every month.
The source was the policy administration export. The work behind the dashboard was mapping scheme codes to clients, defining churn consistently (exits in the period divided by members at the start), and building calculated fields with CASE statements to group customer types. Once that logic lived in the data source rather than in someone's head, the report refreshed from the export instead of being rebuilt.
- Scorecards: members joined, exited, retained, churn rate.
- Breakdowns: churn by client scheme and by customer type.
- Detail: a member list filtered by the same controls as the charts.
Pharma and healthcare example: brand performance against forecast
A healthcare and pharma brand dashboard tracks sales and prescription (Rx) volume, product performance, sales by state on a geo map, top reps, HCP metrics and actual versus forecast by product.
The difficulty here is joining datasets that were never designed to meet. Rx data, sales data and the forecast sit in different systems with different product naming and different date grains. Data Studio blends are limited to 5 sources and equality joins only, so a dashboard like this is usually modelled in BigQuery or a well-structured Sheet first, with a product mapping table doing the reconciliation. Actual versus forecast only means something when both sides use the same product list and the same month boundaries.
Retail example: growth, conversion and stores in one view
A retail dashboard covers month-on-month and quarter-on-quarter revenue growth, conversion rate, sell-through rate, cart abandonment against forecast, online versus in-store sales, store foot traffic and inventory shrinkage.
This example mixes ecommerce data, point-of-sale data and stock data. Store codes, product categories and date formats have to line up before MoM and QoQ comparisons are trustworthy. Growth figures are usually calculated fields comparing the current period with the prior one, which means the date dimension must be continuous and the fiscal calendar agreed in advance.
Manufacturing example: a production dashboard for the plant floor
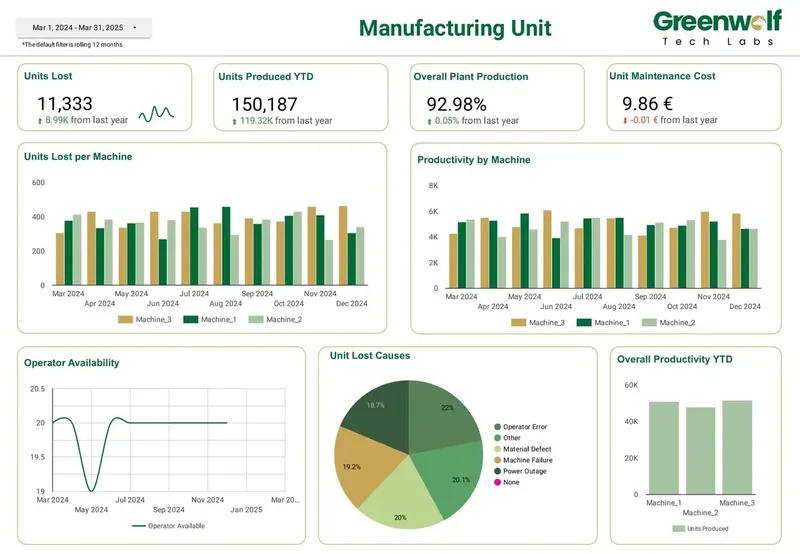
A manufacturing unit dashboard shows units produced and units lost, overall plant production, units lost per machine, productivity by machine, operator availability, causes of unit loss and maintenance cost. None of the 63 templates in Coupler.io's roundup covers production reporting.
Production data often arrives as spreadsheets filled in per shift, with machine names typed by hand. The build starts with a machine master list, a fixed list of loss causes, and a rule for shifts that cross midnight. Only then do charts such as units lost per machine or loss by cause stop disagreeing with the plant manager's own count.
- Output: units produced, units lost, overall plant production.
- Machines: units lost per machine, productivity by machine.
- People and cost: operator availability, maintenance cost, causes of loss.
Logistics and supply chain dashboard examples
A logistics dashboard shows orders by stage (pickup ready, in transit, delivered), shipping method mix, delivery analysis covering cancelled and delayed orders, fleet status and an order tracking table. Its main job is letting an operations lead see what is stuck today.
A supply chain and procurement dashboard is different in rhythm. It covers total procurement spend, savings realized, active suppliers, average supplier lead time, compliance incidents, top suppliers by spend, spend by category and by country, suppliers at risk and approval status. Procurement leads review it weekly or monthly rather than hourly.
Both depend on master data. Logistics needs consistent status codes across carriers. Procurement needs one supplier record per supplier, because duplicates split spend and hide concentration risk. Budget time for the supplier cleanup, because charts like top suppliers by spend are only as good as that list.
Finance and marketing dashboard examples
A CFO or finance dashboard brings cash, revenue, spend and margin into one view for finance leaders. The value is that the numbers come from the same definitions every month, so the leadership meeting discusses the business rather than whose spreadsheet is right.
A marketing dashboard brings multi-channel spend, leads and return together across Google Ads, Meta, LinkedIn, GA4 and Search Console. This is the type most template galleries cover. Where a custom build earns its keep is in consistent channel grouping, cost data from platforms Google does not connect natively (usually through a partner connector), and avoiding GA4 quota errors when many people open the report at once. A standard GA4 property allows 14,000 Data API tokens per project per property per hour, according to Google's Analytics Data API documentation, and a busy report with many charts can exhaust that.
How do these Data Studio dashboard examples compare?
The table summarises each example: who uses it, where the data usually comes from and the hardest part of the build. Use it to estimate which of your own dashboards will be quick and which will need real data work.
| Dashboard | Main users | Typical sources | Hardest part of the build |
|---|---|---|---|
| Insurance membership and churn | Broker management, account managers | Policy administration export | Consistent churn definition and scheme mapping |
| Pharma brand performance | Brand and sales leadership | Sales, Rx and forecast files | Matching product names and date grains |
| Retail growth and stores | Commercial and store operations | Ecommerce, POS, stock | Store and category alignment, fiscal calendar |
| Manufacturing production | Plant managers, maintenance | Shift logs, maintenance records | Machine master list and loss causes |
| Logistics orders and fleet | Operations leads | Order and carrier status data | Status codes across carriers |
| Procurement and suppliers | Procurement and finance | ERP or spend exports, supplier list | Deduplicating the supplier master |
| CFO / finance | Finance leaders | Accounting and budget data | Agreed metric definitions |
| Marketing multi-channel | Marketing teams, agencies | Google Ads, Meta, LinkedIn, GA4, Search Console | Channel grouping and GA4 quotas |
Template or custom build: which do you need?
A template is enough when you report on one or two sources that Data Studio connects natively, such as GA4, Google Ads or Search Console, and you are happy with standard definitions. Copy it, swap the data source, adjust branding and you are done.
A custom build is the better choice when sources arrive as exports or spreadsheets, when several teams must agree on definitions, when you need more than 5 sources in one view, or when a table needs more than the 10 dimensions and 20 metrics allowed on fixed-schema sources such as GA4 and Google Ads. Our Australian insurance brokerage client is a good example: insurer .xls files in shifting layouts were routed through Google Drive into a central Google Sheet with business rules applied, which cut report time from 4-5 hours to under 5 minutes and lifted reporting accuracy from about 75% to 99%. No template would have handled those files.
What to collect before you brief a dashboard build
Whether you hire a team or build in-house, the same short checklist saves weeks. Bring it to the first call and the scope, timeline and quote will all be more accurate.
- The three to five decisions the dashboard must support, written as questions.
- A list of every source, with a sample export from each.
- The definition of each headline metric, including edge cases such as refunds or mid-month joiners.
- Who will view it, how often, and whether anyone needs to see only their own region or client.
- An example of the current report, even if it is a spreadsheet you dislike.
- Who should own the reports and data sources once the build is finished.
Case study · Insurance brokerage, Australia
From 4-5 hours of spreadsheet work to a report in under 5 minutes
Monthly reports were assembled by hand from inconsistent .xls files sent by several insurers. The files now land in Google Drive, are mapped into one central sheet with the business rules applied, and feed a Data Studio dashboard.
- Report time: 4-5 hours to under 5 minutes
- Reporting accuracy: about 75% to 99%
- Visibility across insurers: limited to real time, with filters
FAQ
Frequently asked questions
Where can I find Google Data Studio dashboard examples?
The Data Studio template gallery and vendor roundups such as Coupler.io's list mostly cover marketing, SEO and ecommerce templates. For operational examples like manufacturing, logistics or procurement, look at agency case pages, because those dashboards are built on private company data and rarely published as templates.
Can I copy a Data Studio dashboard example and use my own data?
Yes, if the template uses the same connector as your data, you can copy the report and swap the data source. It works well for GA4, Google Ads and Search Console. It breaks down when your data has different field names or arrives as exports, because the calculated fields and charts expect the original schema.
What should a good Data Studio dashboard include?
A good dashboard starts with a few headline scorecards, then breakdowns that explain them, then a detail table for checking individual records. It uses filters and date controls that apply to every chart, and every metric has a written definition. Fewer, well-chosen charts usually beat a crowded page.
Can Data Studio handle manufacturing or logistics dashboards?
Yes. Data Studio works for production, logistics and procurement reporting as long as the data is prepared first, usually in Google Sheets or BigQuery. The tool is free, so the cost sits in cleaning shift logs, status codes or supplier lists so the charts are trustworthy.
How long does it take to build a custom Data Studio dashboard?
It depends mostly on the data rather than the charts. A dashboard on one clean native connector can be quick, while one that reconciles several exports with inconsistent codes takes longer because of the preparation work. A review of your sources is the most reliable way to get a timeline.
Are Looker Studio dashboard examples still valid now it is called Data Studio?
Yes. Google renamed Looker Studio back to Data Studio in April 2026, and existing reports, templates and data sources moved over automatically. Any example built under the old name works the same way today.
Keep reading
Related pages
Get started
Tell us what your reporting has to do
Describe the dashboards you need, who reads them and where the data sits. We reply within one business day with an approach, the connectors involved and a fixed-price plan.
- Free 30-minute reporting review
- Fixed quote before any work starts
- Everything built and owned in your Google account
Prefer email? info@greenwolftechlabs.com
Get a free proposal
Two lines is enough to start.