
HR dashboard guide
Data Studio HR dashboard: what to track, how to keep it private, and what it costs
A Data Studio HR dashboard brings headcount, turnover, hiring, absence and labour cost into one report that refreshes from your HR, recruiting and payroll systems instead of a spreadsheet rebuilt each month. This guide is for HR, finance and operations leaders at growing companies who want that view without buying another HR analytics platform. We cover the metrics and their formulas, the pages to build, how HR data reaches Data Studio, the privacy controls employee data needs, a worked turnover example, costs and when not to hire anyone.

Quick answer
What should a Data Studio HR dashboard include?
A Data Studio HR dashboard should show headcount against plan, joiners and leavers, voluntary and involuntary turnover, time to hire, absence and labour cost, each with a written formula. It should refresh from HRIS, applicant tracking and payroll exports, and restrict access with named sharing and row-level filters so managers see only their own teams.
- Agree written definitions for headcount, leavers and turnover before anyone designs a chart.
- Most HR systems reach Data Studio through scheduled exports into Sheets or BigQuery.
- Employee data needs named sharing, viewer email filters and suppression of very small groups.
- Data Studio is free; the real costs are data preparation, BigQuery, connectors and upkeep.
What should a Data Studio HR dashboard show?
Start with the six or seven numbers your leadership team already argues about, and give each one a formula and a source system. An HR dashboard fails far more often on definitions than on design: if finance counts contractors in headcount and HR does not, the report starts a debate instead of ending one.
The table below is the metric set we start from with HR and finance teams. Not every company needs every row, and some add engagement survey scores or training completion once the core is trusted. Write each formula into a text box on the page, so anyone reading the number can see how it was built.
| Metric | Formula | Usual source |
|---|---|---|
| Headcount | Active employees on the last day of the period, by an agreed rule for part-time staff and contractors | HRIS export |
| Headcount vs plan | Actual headcount minus budgeted headcount, by department | HRIS plus the finance budget sheet |
| Turnover rate | Leavers in the period divided by average headcount | HRIS leaver records |
| Voluntary turnover | Resignations divided by average headcount | HRIS leaver reason codes |
| Time to hire | Days from requisition opened to offer accepted | Applicant tracking system |
| Offer acceptance rate | Offers accepted divided by offers extended | Applicant tracking system |
| Absence rate | Days absent divided by scheduled working days | Time and attendance or HRIS |
| Labour cost per employee | Gross payroll cost divided by average headcount | Payroll export |
Which pages does an HR analytics dashboard need?
Five pages cover most needs, and each one should answer a single question. Keeping compensation on its own page, or in its own report, also makes the privacy work in a later section much simpler.
Add a report-level date control and a department filter that every page shares, and set the default comparison to the same period last year. HR numbers move slowly and seasonally, so month-on-month comparisons tend to create alarm about normal patterns such as summer leavers or January hiring.
- Workforce overview: headcount by department, location and employment type, against plan, with joiners and leavers for the period.
- Turnover and retention: monthly and rolling 12-month turnover, voluntary versus involuntary, leavers by tenure band and leaver reason.
- Hiring: open requisitions, time to hire by role family, offer acceptance rate and the pipeline by stage.
- Absence and overtime: absence rate by team, the longest open absences, and overtime hours against budget.
- Labour cost: payroll cost by department and cost per employee, on a restricted page shared only with finance and HR leads.
How does HR data get into Data Studio?
For most companies, HR data reaches Data Studio as a scheduled export, not through a live connector. Google's native connectors cover Google Sheets, BigQuery, Cloud SQL, MySQL, PostgreSQL, SQL Server and Redshift alongside its marketing products, but not the HR, recruiting and payroll systems most companies run. Partner connectors cover some of them, so check the connector gallery for your exact system before planning a build.
The usual pattern is that each system exports a file or API extract on a schedule, the file lands in Google Drive or Cloud Storage, and a mapping step aligns employee IDs, department names and dates before the data reaches the report. Small teams can run this in Google Sheets. Once you have several years of history, more than one HR system after an acquisition, or payroll lines per employee per month, BigQuery is the safer home because it holds history cleanly and supports the row-level controls described below.
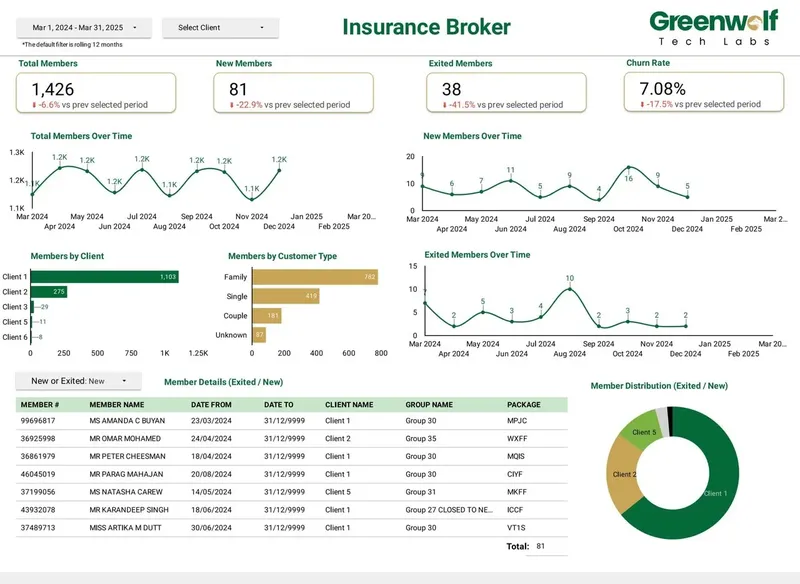
The mapping step is where most of the effort goes. Department names drift between the HRIS and the budget sheet, the applicant tracking system uses its own candidate IDs, and payroll files change layout when a provider updates its template. We have seen the same pattern outside HR: for an Australian insurance brokerage receiving messy .xls files from several insurers, we automated the files into Drive, a central mapping Sheet and business rules, which cut report preparation from 4 to 5 hours to under 5 minutes and lifted accuracy from about 75% to 99%.
How do you calculate employee turnover in a Data Studio HR dashboard?
Divide leavers in the period by average headcount for the same period, then split the result by leaver reason. The arithmetic is simple. The rules about who counts as a leaver are not, so settle them first: internal transfers, contractors whose contracts end, rehires within a set number of days and employees who never started should usually be excluded, and the rule must be written down.
A worked example. A company starts October with 400 employees and ends with 412, so average headcount is 406. During the month 9 people left: 6 resigned and 3 were dismissed or made redundant. Monthly turnover is 9 divided by 406, or 2.2%. Voluntary turnover is 6 divided by 406, or 1.5%, and involuntary turnover is 3 divided by 406, or 0.7%. If 2.2% held every month, annual turnover would be roughly 26%.
For context, the US Bureau of Labor Statistics JOLTS release for August 2026 put the total separations rate at 3.2%, the quits rate at 1.9% and the layoffs and discharges rate at 1.0% across US nonfarm employers. JOLTS divides separations by total employment, so it is a reasonable sense check for a monthly rate, but industry and country differences are large and your own trend line matters more than any national figure.
In Data Studio, the leaver rules usually live in a calculated field built with a CASE statement on termination reason and dates, so that a resignation counts as voluntary and a transfer returns nothing. Rolling 12-month turnover is easier to compute in BigQuery or a prepared Sheet than in the report, because it needs leavers and headcount summed across a moving window.
How do you keep employee data private in Data Studio?
Treat an HR dashboard as confidential by default: share it with named people or groups only, never by public link, and restrict what each viewer can see at the row level. Employee data carries legal obligations in most countries, so agree the access rules with HR and legal before the build, not after the first complaint.
Data Studio supports row-level security through a data source setting called filter by viewer email. Your data needs a column holding the email address of each person allowed to see that row, such as the manager responsible for a team, and Google's documentation notes the addresses must match the viewer's account exactly, including case. In a BigQuery custom query, the @DS_USER_EMAIL parameter does the same job and lets you join against a permissions table, which is easier to maintain when managers change.
Credentials matter too. A data source running on the owner's credentials lets viewers see data they cannot access in the source system, which is what you want for a manager who has no HRIS login, but it also means the report itself is the access boundary. Viewer's credentials push the boundary back to the source system and suit BigQuery tables where access is already managed in Google Cloud.
- Keep compensation and individual-level detail in a separate report with a shorter sharing list.
- Hide any breakdown with fewer than a set number of people, so a chart cannot identify one employee.
- Use pseudonymised employee IDs in the dashboard and keep names in the source system.
- Turn off download, print and copy for viewers on reports that hold personal data.
- Own the report and data sources from a company account, not one HR analyst's login.
Is a free HR dashboard template enough?
A template is enough when your data already sits in one clean sheet and the audience is a small HR team. It stops being enough when data comes from several systems, managers need their own filtered views, or finance needs the numbers to tie back to payroll. The table shows where each approach fits.
| Situation | Better fit | Why |
|---|---|---|
| Under 100 employees, one HRIS, HR team only | Template | One clean export and a small audience need little modelling |
| Several HR, recruiting and payroll systems | Custom build | IDs, departments and dates need mapping before any chart is right |
| Managers should see only their own teams | Custom build | Row-level filters need a permissions column or table |
| Board pack with headcount against budget | Custom build | Plan data from finance must join cleanly to HR actuals |
| Several years of history or acquisitions | Custom build with BigQuery | History and changing structures are easier to hold in a warehouse |
What does a Data Studio HR dashboard cost to build and run?
Data Studio itself is free to build and view reports in. Data Studio Pro costs $9 per user per project per month for creators, editors and managers in Pro workspaces, and viewers need no licence. Pro is worth considering for HR because it adds organisation-owned content, team workspaces, audit logging and alerts, which suit data that should not live in one person's Drive.
The other running costs depend on the route your data takes. BigQuery charges for storage and queries, which stay small for HR-sized data when tables are partitioned by date. Partner connectors for HR systems, where they exist, are priced by their vendors and change often, so check them directly. The build fee is driven by the number of source systems, how messy the exports are, the privacy model and how much history needs cleaning, much more than by the number of charts.
What are the most common HR dashboard mistakes?
Most problems we see come from skipping the definitions and access work to get to the charts sooner. Each of these is cheap to prevent and expensive to fix once leaders have started quoting the numbers.
- Counting headcount differently from finance, so the board sees two figures for the same month.
- Dividing leavers by closing headcount instead of average headcount, which flatters turnover in a growing company.
- Mixing transfers and contract ends into voluntary turnover.
- Sharing the report by link because it was quicker, then forgetting it is open.
- Building on one analyst's credentials, so the report breaks the week they leave.
- Blending HRIS, ATS and payroll inside Data Studio, where blends are limited to 5 sources and equality joins, instead of joining them in Sheets or BigQuery first.
When should you not hire an agency for an HR dashboard?
Do not hire anyone if your HR platform's built-in reports already answer your questions and nobody outside HR needs the numbers. Many HRIS products include headcount and turnover reports, and a separate dashboard only earns its cost when you need to combine HR data with finance, recruiting or operations data, or share it with people who have no HRIS access.
It is also too early if you have not agreed your definitions or cleaned up department and job data. An agency can help facilitate that, but the decisions belong to HR and finance, and a dashboard built before them will be rebuilt.
How does Greenwolf Tech Labs build HR dashboards in Data Studio?
We start with a free review of your HR, recruiting and payroll exports, your current reports and who needs to see what. From that we write a metric dictionary and an access model, then quote a fixed price that lists the pages, data routes, privacy controls and handover.
Our team covers both sides of the work: business intelligence and data automation for the pipeline, and analytics and finance experience for definitions that tie back to payroll and budget. HR views often sit alongside our executive KPI and CFO dashboards, where headcount against plan sits next to revenue and margin. Across 100+ projects for 200+ clients, the pattern is the same: agree the numbers, automate the data, then design the pages.
Case study · Insurance brokerage, Australia
From 4-5 hours of spreadsheet work to a report in under 5 minutes
Monthly reports were assembled by hand from inconsistent .xls files sent by several insurers. The files now land in Google Drive, are mapped into one central sheet with the business rules applied, and feed a Data Studio dashboard.
- Report time: 4-5 hours to under 5 minutes
- Reporting accuracy: about 75% to 99%
- Visibility across insurers: limited to real time, with filters
FAQ
Frequently asked questions
Can you build an HR dashboard in Looker Studio?
Yes. Looker Studio is now called Data Studio again, and existing reports moved over automatically. An HR dashboard can be built in it from HRIS, applicant tracking and payroll data, usually brought in through Google Sheets or BigQuery.
What KPIs should an HR dashboard track?
Most start with headcount against plan, joiners and leavers, voluntary and involuntary turnover, time to hire, offer acceptance rate, absence rate and labour cost per employee. Each needs a written formula agreed with finance so the numbers match other reports.
How do I calculate monthly employee turnover?
Divide the number of leavers in the month by average headcount for the month, which is opening plus closing headcount divided by two. For example, 9 leavers on an average headcount of 406 is 2.2%. Exclude internal transfers and agree how contractors are treated.
Can managers see only their own team in a Data Studio report?
Yes. Turn on filter by viewer email in the data source and add a column holding the manager's email address for each row. In BigQuery, a custom query using the @DS_USER_EMAIL parameter can join against a permissions table instead.
Does Data Studio connect directly to HR systems?
Usually not through a native connector. Google's native connectors focus on its own products and databases, so HR data typically arrives as scheduled exports into Google Sheets or BigQuery, or through a partner connector where one exists for your system.
Is it safe to put employee data in Data Studio?
It can be, if access is designed carefully. Share only with named people, use row-level filters, keep compensation in a separate report, suppress very small groups and own everything from a company account. Agree the rules with HR and legal before building.
How much does an HR dashboard in Data Studio cost?
Data Studio is free, and Pro is $9 per user per project per month for editors if you want team workspaces and audit logging. The build cost depends on source systems, data quality, privacy rules and history, so we quote a fixed price after a free review.
Keep reading
Related pages
Get started
Tell us what your reporting has to do
Describe the dashboards you need, who reads them and where the data sits. We reply within one business day with an approach, the connectors involved and a fixed-price plan.
- Free 30-minute reporting review
- Fixed quote before any work starts
- Everything built and owned in your Google account
Prefer email? info@greenwolftechlabs.com
Get a free proposal
Two lines is enough to start.