
Sales reporting
Data Studio sales dashboard: pipeline, rep performance and forecast in one report
A Data Studio sales dashboard puts revenue against quota, open pipeline by stage, win rate, sales cycle length and rep performance in one shared report, fed from your CRM instead of a spreadsheet someone rebuilds every Monday. This guide is for sales leaders, revenue operations teams and founders deciding whether a free template is enough or whether they need a custom build. We cover the metrics, the pages, how CRM data gets in, the data model that makes trends and forecasts possible, what drives cost, and when you should not hire anyone.
Quick answer
What should a Data Studio sales dashboard include?
A Data Studio sales dashboard should show closed revenue against quota, open pipeline by stage and close month, win rate, average deal size, sales cycle length and activity by rep. The numbers come from the CRM through a connector, Google Sheets or BigQuery, and daily pipeline snapshots make trend and forecast views possible.
- Agree one written definition per metric before building, especially win rate and pipeline.
- CRM data reaches Data Studio through partner connectors, Google Sheets or BigQuery.
- Daily pipeline snapshots are what make trend, slippage and forecast views possible.
- Templates suit a single clean CRM; custom builds suit quotas, multiple systems and forecasting.
What should a Data Studio sales dashboard show?
It should answer four questions in under a minute: are we on track for the period, is there enough pipeline to hit next period, which deals and reps need attention, and where in the funnel deals are lost. Everything else belongs on a detail page.
The metrics below are the core set we use on most builds. The column that matters most is the last one, because each metric has a common way of being calculated wrong, and a sales team that catches one wrong number on the dashboard stops trusting all of it.
| Metric | Definition to agree in writing | Where it is usually miscounted |
|---|---|---|
| Closed revenue vs quota | Sum of won deal amount by close date, against the period quota per rep and team | Using created date instead of close date, or ignoring currency |
| Open pipeline | Sum of open deal amount by expected close month and stage | Including deals with close dates already in the past |
| Pipeline coverage | Open pipeline closing in the period divided by quota still to win | Dividing by the full quota instead of the remaining quota |
| Win rate | Won deals divided by won plus lost deals closed in the period | Counting open deals in the denominator, or mixing count and value |
| Average deal size | Won amount divided by number of won deals | Letting one unusually large deal skew the average without a median beside it |
| Sales cycle length | Days from deal created to closed won | Measuring from first contact on some deals and deal creation on others |
| Stage conversion | Share of deals that move from each stage to the next | Calculating from the current stage only, which hides skipped stages |
| Activity by rep | Calls, meetings and emails logged per rep per week | Treating logged activity as a measure of quality |
Which pages does a sales dashboard need?
Most sales teams need four or five pages, each with one audience. Putting everything on one long page is the fastest way to make sure nobody reads it.
Report-level date and team filters carry the same selection across every page, so a sales director who picks Q3 and the EMEA team on the summary sees the same slice on the rep page. Cross-data-source filtering, added to Data Studio in January 2026, lets one filter control charts that read from different sources, such as CRM deals and marketing leads.
- Summary for leadership: closed revenue against quota, coverage for this period and next, win rate and a short trend line for each.
- Pipeline page for sales managers: open deals by stage and close month, deals with past close dates, and deals with no activity in the last 14 days.
- Rep performance page: quota attainment, win rate, cycle length and activity per rep, with a table that managers can sort in one-to-ones.
- Forecast page: committed, best case and pipeline by close month, plus how the forecast has moved week by week.
- Funnel page shared with marketing: leads to opportunities to won deals by source, which links sales reporting to the marketing dashboard.
How does CRM data get into Data Studio?
CRM data usually reaches Data Studio in one of three ways: a partner connector that reads the CRM directly, an export or sync into Google Sheets, or a load into BigQuery. Google's native connectors cover its own products, databases and BigQuery, so HubSpot, Salesforce and Pipedrive data normally comes through a partner such as Supermetrics, Windsor.ai, Porter Metrics, Funnel, Power My Analytics or Catchr. Google keeps adding partner connectors to the gallery, with a new batch announced in the Data Studio release notes on September 24, 2026.
Each route has a ceiling. A direct connector is quickest to set up, but every chart sends its own request, and the CRM limits how many requests it will answer. HubSpot's developer documentation (API usage guidelines and limits, checked October 2026) sets private app limits of 100 requests per 10 seconds on Free and Starter, and 190 per 10 seconds on Professional and Enterprise, with daily caps of 250,000, 625,000 and 1,000,000 requests per account. A busy report with many charts and viewers can push against those limits, which shows up as slow or failed charts.
Blends are the other limit. A blend in Data Studio joins at most 5 sources, only on equal keys, and lives inside one report. Joining deals to owners, companies, quota targets and marketing leads quickly uses that up. Once a sales dashboard needs quotas, more than one system or history over time, we model the data in BigQuery or a structured Google Sheet and point Data Studio at one clean table.
| Route | Best for | Watch out for |
|---|---|---|
| Partner connector, live | One CRM, small team, current-state views only | API limits, connector subscription cost, no history of how deals changed |
| Google Sheets bridge | Small volumes and teams that already keep quotas in Sheets | Sheet size, manual edits breaking columns, refresh timing |
| BigQuery model | Several systems, quotas, snapshots, many viewers | Needs partitioned tables and someone to own the pipeline |
Why does a sales dashboard show different numbers from the CRM?
Usually because the dashboard and the CRM's own reports use different definitions, not because either is broken. The fix is to decide which definition is right, write it down and make both match.
The most common causes we find in CRM data are predictable, and a good build checks for each one before launch rather than after the first awkward pipeline meeting.
- Close dates: deals left open with close dates in the past inflate this month's pipeline until someone tidies them.
- Owner changes: when a deal moves to a new rep, history reports credit the current owner unless the model keeps the owner at close.
- Duplicates: the same opportunity created twice, once by a rep and once by an integration.
- Currency: deals in several currencies summed as if they were one, which a calculated field with a rate table fixes.
- Stage changes: pipelines renamed or reordered mid-year, so last year's stages no longer map to this year's.
- Filters: the CRM report excludes a deal type or pipeline that the dashboard includes, or the other way round.
How do you show pipeline trend and forecast in Data Studio?
You need snapshots. A CRM stores where each deal is now, so a live connector can show today's pipeline but not what it looked like last Monday. To show how pipeline grew, which deals slipped to a later month and how the forecast moved, the model saves a copy of every open deal each day, with its stage, amount, owner and close date.
In BigQuery that is one table partitioned by snapshot date, so a chart that reads the last 90 days scans only those partitions and the query bill stays small. A CASE statement in a calculated field groups stages into committed, best case and pipeline, and a comparison date range shows the movement against the previous week.
Here is a worked example with illustrative numbers. A team has a quarterly quota of $600,000 and has closed $150,000, so $450,000 is still to win. Open deals with close dates in the quarter total $1,350,000, which gives pipeline coverage of 3.0 times the remaining quota. If the team's historical win rate on deals open at this point in a quarter is 25%, that pipeline is expected to produce about $337,500, leaving a gap of about $112,500 that has to come from new deals or larger ones. Only snapshot data can tell you the historical win rate at this point in the quarter, which is why a forecast page built on a live connector alone is guesswork.
Is a free sales dashboard template enough?
A template is enough when you have one CRM, one pipeline, clean data and no quotas to track. Connector vendors publish free HubSpot, Salesforce and Pipedrive sales templates, and copying one takes minutes.
Templates stop working when the dashboard has to reflect how your team actually sells. They assume the vendor's field names and stages, they read live data with no history, and they rarely include quotas, multiple currencies or a second system such as billing or marketing data.
| Your situation | Template | Custom build |
|---|---|---|
| One CRM, one pipeline, current numbers only | Usually enough | Not needed yet |
| Quotas by rep and team | Needs manual work | Targets table joined to actuals |
| Trend, slippage and forecast views | Not possible with live data alone | Daily snapshots in BigQuery |
| CRM plus billing, marketing or ERP data | Hits the 5-source blend limit | One modelled table per subject |
| Many viewers and charts | Risk of connector and API limits | Cached, modelled data |
| Multiple currencies or regions | Rarely handled | Rate table and region mapping |
What does a Data Studio sales dashboard cost to build and run?
The build cost depends mostly on how many systems feed it and how clean the CRM data is, not on the number of charts. A single clean CRM with a quota sheet is a modest project. Several pipelines, owner history, currencies and daily snapshots in BigQuery are a larger one, and most of that effort is data work the viewer never sees.
Running costs sit outside any agency fee. Data Studio itself is free to build and view. Data Studio Pro is $9 per user per project per month for creators, editors and managers in Pro workspaces, and viewers need no licence, so a sales team of fifty reading the dashboard adds no licence cost. Partner connectors charge their own subscriptions, which change often, so check them with the vendor. BigQuery charges for storage and queries, which partitioned snapshot tables keep small. Our pricing guide explains how agencies structure quotes and how to compare them.
What are the most common sales dashboard mistakes?
Most failed sales dashboards fail on definitions and trust, not on design. Use this checklist before launch, whoever builds it.
- Metrics built before definitions are agreed, so sales and finance argue about the number instead of the deal.
- No reconciliation: closed revenue for a past quarter should match the CRM and finance to the dollar before anyone sees the dashboard.
- Quotas typed into chart titles instead of kept in a targets table that sales operations can update.
- Rep pages shared with the whole company without thinking about who should see whose numbers.
- No last-updated date on the page, so a broken connector shows stale numbers silently, and Data Studio gives no warning when a connector breaks.
- Too many scorecards on the summary, so the four numbers that matter are lost among twenty.
When should you not hire an agency for a sales dashboard?
Do not hire anyone if your CRM's built-in reports already answer your questions and nobody needs the numbers outside the CRM. HubSpot and Salesforce both ship their own reporting, and a second copy of the same view adds a maintenance job without adding insight.
Also hold off if the CRM data is not yet used consistently. If reps do not update stages or close dates, a dashboard will show that problem very clearly but cannot fix it. Agree the sales process and the required fields first, run it for a few weeks, then build. An agency makes sense when the report has to combine the CRM with quotas, finance, marketing or operational data, when leadership needs a trusted forecast, or when nobody in the team has time to own the pipeline.
How does Greenwolf Tech Labs build sales dashboards in Data Studio?
We start with a free review of your CRM, a sample of the raw deal data, any current reports and the decisions the dashboard has to support. Then we run a short definitions session, build the data model, build the pages, and check every headline number against the CRM and finance before handover. The quote is a fixed price that lists what we build and the running costs you should expect.
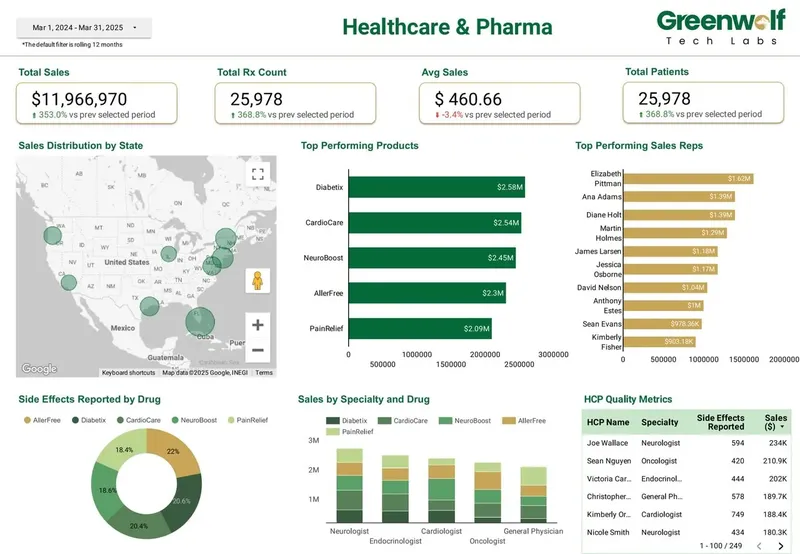
Our healthcare and pharma brand performance dashboard is a sales dashboard in practice: sales and prescription volume, product performance, sales by state on a map, top reps, HCP metrics and actual against forecast by product. The same pattern of targets joined to actuals, rep rankings and geographic views carries over to B2B pipeline reporting. After launch, our managed reporting service can own connector monitoring, new pages and quota updates each period, so the dashboard keeps matching the CRM.
FAQ
Frequently asked questions
Can Data Studio connect to HubSpot or Salesforce?
Yes, through a partner connector, a sync into Google Sheets, or a load into BigQuery. Vendors such as Supermetrics, Windsor.ai and Porter Metrics offer CRM connectors with their own subscriptions. For quotas, history and many viewers, a BigQuery model is the more reliable route.
Is there a free Data Studio sales dashboard template?
Yes. Several connector vendors publish free sales and pipeline templates for HubSpot, Salesforce and Pipedrive. They work well for one clean CRM and current-state views, but they do not include quotas, history or forecast movement.
How do I add sales quotas to a Data Studio dashboard?
Keep quotas in a Google Sheet or BigQuery table by rep, team and month, then join them to closed revenue on the same keys. Sales operations can then change a quota in the sheet without anyone editing charts, and scorecards show actual, quota and percent to quota.
Why can't my sales dashboard show last month's pipeline?
Because the CRM stores each deal's current state, not its history. To see past pipeline, slipped deals and forecast movement, the model has to save a daily snapshot of open deals, usually in a date-partitioned BigQuery table.
How long does it take to build a sales dashboard in Data Studio?
A template on one clean CRM can be live the same day. A custom build with quotas, several sources and snapshots takes longer, and the time goes mainly into data checks and agreeing definitions. We give a timeline with the fixed quote after the free review.
Do sales reps need a Data Studio licence to view the dashboard?
No. Viewing Data Studio reports is free. On Data Studio Pro, only creators, editors and managers need the $9 per user per project per month licence, so the sales team can read the dashboard at no licence cost.
Should the sales dashboard live in Data Studio or in the CRM?
Keep single-system views in the CRM if its reports already answer the question. Move to Data Studio when you need to combine the CRM with quotas, finance, marketing or operations data, or share the view with people who do not use the CRM.
Keep reading
Related pages
Get started
Tell us what your reporting has to do
Describe the dashboards you need, who reads them and where the data sits. We reply within one business day with an approach, the connectors involved and a fixed-price plan.
- Free 30-minute reporting review
- Fixed quote before any work starts
- Everything built and owned in your Google account
Prefer email? info@greenwolftechlabs.com
Get a free proposal
Two lines is enough to start.