
Comparison
Data Studio vs Excel: which one should run your reporting?
Data Studio vs Excel is rarely an either-or choice: Data Studio is better for recurring reports that many people read, and Excel is better for modelling, forecasting and one-off analysis. This guide is for finance, operations and marketing teams whose monthly reporting still lives in workbooks and who want to know what to move, what to keep, and what it costs. We cover the hard limits on both sides, 2026 pricing, a worked example and the mistakes we see when teams switch.

Quick answer
Should I use Data Studio or Excel for business reporting?
Use Data Studio for recurring reports that refresh from live sources and are shared with many readers, because viewers need no licence and nobody copies data by hand. Keep Excel for financial models, budgets, scenarios and ad hoc analysis. Most teams end up with both: Excel or Sheets for inputs, Data Studio for the reporting layer.
- Data Studio suits recurring, shared reports; Excel suits modelling, budgeting and one-off analysis.
- Data Studio's Excel connector takes uploads up to 100 MB and one worksheet per data source.
- Data Studio is free for viewers and creators; Pro is $9 per user per project per month.
- Run old and new reports side by side for a cycle before retiring the workbook.
Data Studio vs Excel: which should you use for reporting?
Choose Data Studio when the same report is produced every week or month, pulls from systems that have connectors, and is read by people who should not be editing it. Choose Excel when the work is a model rather than a report: a budget, a forecast, a pricing scenario, or an analysis you will run once and then throw away.
The two tools were built for different jobs. Excel is a calculation engine with a grid on top, so it is excellent at formulas, what-if tables, Power Query transformations and pivot tables that one analyst controls. Data Studio is a reporting layer: it connects to sources such as GA4, Google Ads, Search Console, Google Sheets, BigQuery and SQL databases, and turns them into interactive pages that anyone with the link can filter. It does not store a working copy of your numbers the way a workbook does.
The table below is the quick version. If most of your answers land in the left column, your reporting has outgrown Excel. If they land in the right column, the workbook is doing its job.
| Question | Points to Data Studio | Points to Excel |
|---|---|---|
| How often is the report produced? | Weekly, monthly or continuously | Once, or on demand for a specific decision |
| Where does the data come from? | Ad platforms, GA4, CRM, databases, Sheets | Typed inputs, assumptions, a single export |
| Who reads it? | Many people, inside and outside the company | One analyst or a small finance team |
| What do readers do with it? | Filter, drill down and check trends | Change assumptions and recalculate |
| How bad is a stale number? | Costly: decisions run on it daily | Acceptable: it is a point-in-time model |
| Does the output need write-back? | No, it is read-only reporting | Yes, users enter or adjust figures |
What is the real difference between an Excel dashboard and a Data Studio dashboard?
An Excel dashboard is a file, and a Data Studio dashboard is a live view. That single difference explains most of the trade-offs teams feel day to day.
Because a workbook is a file, someone has to refresh it: download exports, paste them into a raw-data tab, check that the formulas still point to the right ranges, and send the new version around. Every copy that leaves the inbox becomes its own version, which is how finance teams end up with management_pack_final_v7.xlsx and a debate about which number is right.
A Data Studio report reads from its data sources each time it is opened or refreshed, subject to caching. There is one link, one version and one set of calculated fields. Access is controlled through sharing, and each data source runs on either the owner's credentials or the viewer's credentials, which decides whether a reader sees everything or only what their own Google account can reach. Scheduled email delivery sends the report to stakeholders without anyone attaching a file.
The flip side is that Data Studio is deliberately limited as a calculation tool. Calculated fields and CASE statements handle most reporting logic, and parameters let readers try a value, but there is no cell-by-cell modelling, no Solver and no way for a reader to type a new budget figure into the report.
Where does Excel beat Data Studio?
Excel wins whenever people need to change numbers rather than read them. Budgets, forecasts, cash flow models, commission plans and pricing scenarios depend on inputs that a person types, adjusts and argues over. Data Studio has no write-back, so those workflows belong in a spreadsheet.
Excel is also the better tool for exploratory, one-off analysis. A finance analyst reconciling a vendor statement, or an operations lead checking a single month of returns, can do it faster with a pivot table and a few lookups than by building a data source and a report page.
- Financial modelling, what-if tables, Goal Seek and Solver.
- Data entry and manual adjustments, such as accruals or forecast overrides.
- Offline work and files that must travel as attachments, for example to auditors.
- Macros and VBA automation that a team already depends on.
- Ad hoc analysis of a single export that will not be repeated.
Where does Data Studio beat Excel?
Data Studio wins when the same report is rebuilt on a schedule from systems that already hold the data. The time saved is not in the charts, it is in the copying, pasting and checking that disappears once the report reads directly from its sources.
Sharing is the second advantage. A Data Studio report can be opened by a board member, a regional manager or an external client in a browser, and viewers need no licence, including on Data Studio Pro. Filter controls, date range controls and drill-downs let each reader answer their own question without asking the analyst for a new cut of the workbook.
The third advantage is consistency. A metric such as gross margin or cost per lead is defined once as a calculated field in the data source, so every chart and every page uses the same formula. In a workbook, the same metric is often recalculated on several tabs, and one of them is eventually wrong.
- Native connectors for GA4, Google Ads, Search Console, YouTube, Sheets, BigQuery, Cloud SQL, MySQL, PostgreSQL, SQL Server and Redshift.
- Partner connectors for platforms Google does not cover, such as Meta, LinkedIn or accounting tools.
- One link and one version, with sharing controlled per person or domain.
- Scheduled email delivery, plus Slack and Google Chat delivery and alerts on Data Studio Pro.
- Viewer-side filters, drill-downs and, since June 2026, viewer manual refresh where the editor allows it.
What limits decide between Data Studio and Excel?
A handful of hard limits settle many Data Studio vs Excel decisions before any preference comes into it. These are the published figures from Microsoft's Excel specifications page and Google's Data Studio documentation, checked in November 2026.
The Excel connector limits matter most for teams who plan to keep their workbooks and simply point Data Studio at them. An uploaded workbook becomes a copy, it connects one worksheet per data source, and pivot tables, macros and multi-row headers do not come across. In practice that means the workbook has to be reshaped into flat tables first, or the data moved into Google Sheets or BigQuery, which is usually the better long-term home.
| Limit | Excel | Data Studio |
|---|---|---|
| Rows per sheet or table | 1,048,576 rows by 16,384 columns per worksheet (Microsoft) | No sheet limit; large queries can hit too many rows errors, so aggregate or use BigQuery |
| Memory | 32-bit Excel shares 2 GB of address space with workbook and add-ins (Microsoft) | Runs in the browser against the source; heavy reports are slowed by source queries, not local memory |
| Working with Excel files | Native | Upload up to 100 MB, one worksheet per data source, no pivot tables, macros, multi-row headers or password-protected files (Google) |
| Excel upload storage | Not applicable | 2 GB per user, 5 GB on Data Studio Pro (Google) |
| Combining sources | Lookups and Power Query across any number of tabs | Blends of up to 5 data sources with equality joins; larger models move to BigQuery |
| Table width | Any number of columns up to the sheet limit | 10 dimensions and 20 metrics on GA4 and Google Ads tables; 100 and 100 on Sheets, BigQuery and SQL |
| API quotas | Not applicable to files | GA4 Data API: 14,000 tokens per project per property per hour on standard properties |
How much does Data Studio cost compared with Excel in 2026?
Both tools can be close to free at the margin, so the real cost difference is labour, not licences. Data Studio is free for creators and viewers. Data Studio Pro costs $9 per user per project per month and is only needed for team workspaces, organisation-owned content, hourly scheduling, alerts and similar governance features; only creators, editors and managers in Pro workspaces need a licence.
Excel comes with Microsoft 365. According to Office Watch, Microsoft raised Microsoft 365 Business Basic from $6 to $7 per user per month and Business Standard from $12.50 to $14 on July 1, 2026, while Business Premium stayed at $22. Business Standard and Premium include the desktop apps. Most companies already pay for this for email, so Excel itself rarely adds cost.
Where Data Studio does add cost is in the plumbing. Partner connectors for non-Google platforms are paid subscriptions set by each vendor, and BigQuery charges for storage and queries if your data moves there. The hidden cost on the Excel side is the analyst hours spent rebuilding the same pack every cycle, plus the cost of decisions made on a wrong or stale figure.
| Cost line | Excel-based reporting | Data Studio reporting |
|---|---|---|
| Software licence | Microsoft 365 Business Standard $14 per user per month (Office Watch, July 2026) | Free; Pro $9 per user per project per month for creators only |
| Licences for readers | Readers need access to the file and usually a Microsoft 365 seat to edit | None; viewers never need a licence |
| Connectors | None, but data is copied by hand | Native connectors free; partner connectors priced by the vendor |
| Data storage | Files on OneDrive or SharePoint | Sheets free; BigQuery billed by storage and queries |
| Recurring labour | Analyst time to refresh, check and send every cycle | Monitoring and changes, often on a support retainer |
Worked example: moving a monthly management pack out of Excel
Take a common setup: a mid-size company whose finance lead builds a monthly management pack in Excel. It has eight tabs, fed by five exports: a profit and loss export from the accounting system, a pipeline export from the CRM, Google Ads and GA4 downloads for marketing, and a budget workbook maintained by finance.
Here is how the work splits. The budget stays a spreadsheet, because people type into it, but it moves to Google Sheets in a flat layout with one row per month, cost centre and account, so Data Studio can read it live. The CRM and accounting exports land in Sheets or BigQuery on a schedule through a connector or a small automated pipeline. Google Ads and GA4 connect natively. Data Studio then becomes the reporting layer: a summary page with revenue, gross margin and cash against budget, a marketing page with spend, leads and cost per lead, and a pipeline page by stage and owner.
Two limits shape the design. Actual versus budget across five sources exceeds what a single blend should carry, so the actuals and budget are joined into one table in BigQuery or a mapping sheet before they reach the report. And GA4 charts are kept to the pages that need them, because many GA4 charts opened by many viewers can run into the hourly token quota.
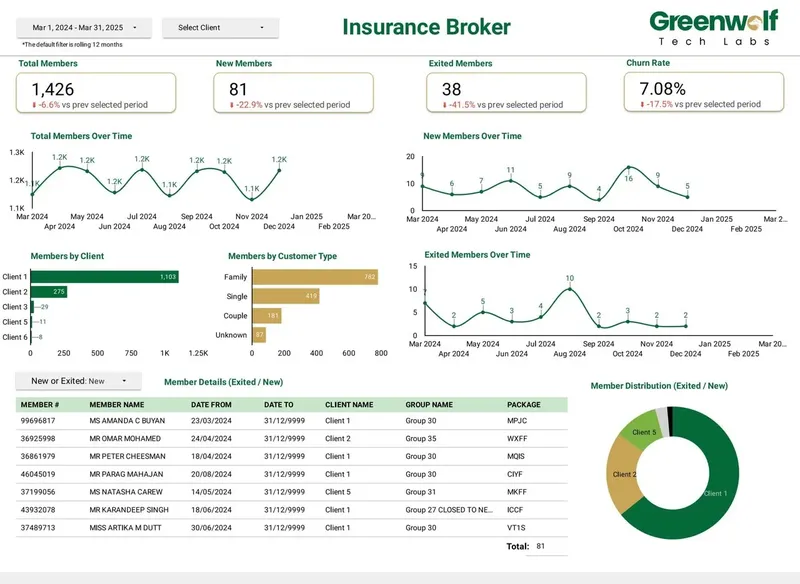
The same pattern worked for an Australian insurance brokerage we worked with. It received messy .xls files from multiple insurers every month. We routed the files into Google Drive, mapped them into a central Google Sheet, applied the business rules there and fed the dashboard from it. Report preparation fell from 4 to 5 hours to under 5 minutes, and reporting accuracy rose from about 75% to 99%. Excel files did not disappear from that process, they simply stopped being the report.
How do you move reporting from Excel to Data Studio?
Move one report at a time, and do not retire the workbook until the new version has matched it for at least one full reporting cycle. Trust in the numbers is the asset you are protecting, and it is lost far faster than it is earned.
The steps below are the order our team follows. The step people skip most often is the second one: writing down exactly how each metric is calculated in the current workbook, including the manual adjustments nobody remembers making.
- Inventory: list every tab, every source export, who prepares it and who reads it.
- Define metrics: document each formula, filter and manual adjustment in plain language.
- Choose the landing layer: native connectors where they exist, Google Sheets for small manual inputs, BigQuery for large or multi-source data.
- Reshape the data: one header row, one record per row, consistent dates and codes.
- Build the report: calculated fields, CASE logic, filter controls and access rules.
- Reconcile: run the workbook and the report side by side and match totals to the source systems.
- Retire and hand over: archive the workbook, document the data sources and set up scheduled delivery.
Common mistakes, and when not to switch from Excel
The most common mistake is pointing Data Studio at the existing workbook and expecting it to behave like Excel. Merged cells, multi-row headers, subtotal rows and pivot layouts all break the connection or produce wrong sums. The data has to be flat before it is reported.
The second is rebuilding every tab. A workbook often carries years of one-off analyses that nobody reads. Moving them all wastes budget and clutters the new report, so cut the pack to the pages that support a real decision. The third is forgetting credentials: a report built on one employee's personal access breaks the day that person leaves, so data sources should be owned by a shared or organisation account.
There are also cases where you should not switch at all. If the report is produced once a year, has one reader, or is really a model with typed assumptions, Excel is the right tool and a Data Studio project would add cost without saving time. The same is true when the source system cannot be connected and someone will be pasting exports into Sheets by hand anyway: fix the data flow first, or the dashboard just moves the manual work to a different screen.
How Greenwolf Tech Labs helps teams move reporting out of Excel
We start with a free review of your current workbooks, the systems behind them and the decisions the reports support. Then we quote a fixed price for the work: what moves to Data Studio, what stays in a spreadsheet, how the data gets there, and what running costs to expect.
We have delivered 100+ projects for 200+ clients, and our Data Studio work includes CFO dashboards that put cash, revenue, spend and margin in one view, and executive KPI dashboards built from several sources. If your monthly pack takes days to assemble or nobody agrees which version is right, send us the workbook and we will show you which parts belong in Data Studio and which should stay in Excel.
Case study · Insurance brokerage, Australia
From 4-5 hours of spreadsheet work to a report in under 5 minutes
Monthly reports were assembled by hand from inconsistent .xls files sent by several insurers. The files now land in Google Drive, are mapped into one central sheet with the business rules applied, and feed a Data Studio dashboard.
- Report time: 4-5 hours to under 5 minutes
- Reporting accuracy: about 75% to 99%
- Visibility across insurers: limited to real time, with filters
FAQ
Frequently asked questions
Is Data Studio better than Excel?
Data Studio is better for recurring, shared reports that refresh from live sources. Excel is better for financial models, budgets and one-off analysis where people change the numbers. Most teams use both, with spreadsheets for inputs and Data Studio for the reporting layer.
Can Data Studio replace Excel?
It can replace Excel as the place where reports are produced and shared, but not as a modelling tool. Data Studio has no cell-by-cell calculation, no write-back and no Solver. Budgets, forecasts and scenario work should stay in Excel or Google Sheets.
Can I connect Excel to Data Studio?
Yes. Data Studio has a Microsoft Excel connector that accepts uploads up to 100 MB, with one worksheet per data source. Pivot tables, macros, multi-row headers and password-protected files are not supported, so many teams move the data into Google Sheets or BigQuery instead.
Is Data Studio free compared with Excel?
Data Studio is free for creators and viewers, while Excel comes with a paid Microsoft 365 plan. Data Studio Pro costs $9 per user per project per month, and only creators, editors and managers need it. Partner connectors and BigQuery can add running costs.
Is Looker Studio vs Excel the same comparison as Data Studio vs Excel?
Yes. Google renamed Looker Studio back to Data Studio in April 2026, and existing reports moved over automatically. Any comparison written under the old name applies to Data Studio today.
How large a dataset can Data Studio handle compared with Excel?
An Excel worksheet holds 1,048,576 rows. Data Studio has no fixed sheet size, but its Excel upload limit is 100 MB and very large queries can return too many rows errors. For large datasets, BigQuery with date partitioning is the usual source.
How long does it take to move a monthly Excel report to Data Studio?
It depends on how many sources feed the workbook and how clean they are. A report fed by native connectors moves quickly, while one built from messy exports needs data preparation first. Plan for at least one reporting cycle of side-by-side reconciliation before retiring the workbook.
Keep reading
Related pages
Get started
Tell us what your reporting has to do
Describe the dashboards you need, who reads them and where the data sits. We reply within one business day with an approach, the connectors involved and a fixed-price plan.
- Free 30-minute reporting review
- Fixed quote before any work starts
- Everything built and owned in your Google account
Prefer email? info@greenwolftechlabs.com
Get a free proposal
Two lines is enough to start.