
Franchise guide
Franchise reporting dashboard: one Data Studio report for every location
A franchise reporting dashboard puts every location's sales, marketing and local search results in one report, with a network view for the franchisor and a filtered view for each franchisee. This guide is for franchisor marketing and operations teams, and for the agencies that report for them. We cover what to track at each level, how to map locations to their data, how to give franchisees access to their own numbers only, and when Data Studio is the wrong tool.
Quick answer
What is a franchise reporting dashboard and how do you build one?
A franchise reporting dashboard is one report that shows performance for the whole network, each region and each location, from the same data. In Data Studio you build it on a location master table that links every store to its ad accounts, analytics and sales data, then use filter by email so each franchisee sees only their own rows.
- Build one report on a location master table instead of copying a report per store.
- Data Studio filter by email can show each franchisee only their own location's rows.
- Past a handful of locations, multi-location data belongs in BigQuery rather than blends.
- Per-dashboard reporting software gets more expensive with every location you open.
What should a franchise reporting dashboard show?
A franchise reporting dashboard should answer three questions from the same numbers: how is the network doing, which regions and locations are ahead or behind, and what should one franchisee do next month. If the franchisor and the franchisee see different totals, the report has failed before anyone reads it.
That means three levels of view, not three reports. The network page ranks locations, the region page compares peers, and the location page shows one store against its own history and target. Every page reads from the same data source, so a figure on the location page always adds up to the figure on the network page.
The metrics depend on what the franchise sells, but most networks need a mix of sales, marketing and local search data. The table below is a starting point we adapt per brand.
| Level | Who reads it | Typical metrics | Main question |
|---|---|---|---|
| Network | Franchisor leadership | Total revenue, same-store growth, marketing spend, cost per lead, locations above and below target | Is the system growing, and where is it not? |
| Region | Regional or area managers | Revenue and leads per location, ranking within the region, spend share | Which locations need attention this month? |
| Location | Franchisee and field consultant | Revenue vs target, leads and calls, local ad results, website conversions, profile actions such as calls and direction requests | What changed at my store, and why? |
| Marketing fund | Franchisor marketing team | Brand fund and local spend by channel, cost per lead by location, campaign results | Is shared marketing money working for every location? |
Why do multi-location reports break as the network grows?
Multi-location reporting usually breaks for structural reasons, not because of the charts. The first ten locations get a copied report each. By location thirty, the copies have drifted, nobody knows which ad account belongs to which store, and a change to the template means editing thirty files.
The problem is not limited to one tool. On Google's developer community, a user building multi-location dashboards for clients in Looker, Google's separate enterprise BI product, described dashboards that become slow at size and "enormous PDFs with numerous tiles of varying length", and the thread had no answer. That is the typical result of putting every location on one page instead of designing filtered views, and it happens in Data Studio for the same reason.
- Inconsistent location names: "Austin North", "ATX-N" and store 014 are the same place in three systems.
- Accounts without an owner: ad accounts, analytics properties and listings were set up by different people over the years.
- Copied reports: every fix has to be repeated by hand, so some locations never get it.
- Sharing by link: franchisees can see each other's numbers when a report is shared too widely.
- Quota and speed problems: dozens of live connections to GA4 and ad platforms slow every page.
How do you map every location to its data?
Start with a location master table: one row per location, and one column for every identifier that location has in every system. This table is the most important part of a multi-location dashboard, and it is the part vendor templates skip.
The master table can live in Google Sheets for a small network or in BigQuery for a large one. Every other data set joins to it on the location ID, so a new store appears in every chart the day its row is added. Closing a location means changing its status, not deleting history.
- Location ID: a short code that never changes, used as the join key everywhere.
- Name, region, area manager and status (open, opening, closed) with open date.
- Franchisee email address, exactly as their Google sign-in spells it.
- Point-of-sale or ERP store code, so sales data can join.
- Google Ads account ID or the campaign naming pattern that marks a location's campaigns.
- GA4 property, or the page path or hostname that identifies the location's pages on a shared site.
- Business listing identifier and any call tracking number assigned to the store.
- Monthly targets for revenue and leads, so pages can show actual against target.
One franchise dashboard or one report per location?
For most networks, one report with filtered access beats a copy per location. A single report means one place to fix a calculated field, one set of data sources to monitor, and figures that always reconcile between franchisee and franchisor.
Data Studio supports this with filter by email. According to Google's Data Studio documentation, the data set must contain the full email address of each viewer, the match is case-sensitive, viewers must sign in even if the report is shared publicly, and each viewer must consent to the report using their email address. Each row holds one email, so a franchisee with three stores gets three rows, and a location with two owners needs a blend or a mapping table. On BigQuery sources, the @DS_USER_EMAIL parameter can filter inside a custom query.
Copies per location still make sense in two cases: when locations are owned by separate companies that each want their own branded report, and when an agency reports for several independent franchisees rather than for the franchisor. Our white label reporting process is built for that second case.
| Approach | How access works | Best for | Watch out for |
|---|---|---|---|
| One report, filter by email | Each signed-in franchisee sees only rows with their email | Franchisors with 10 or more locations and shared data | Case-sensitive emails, sign-in required, one email per row |
| One report, location filter only | Everyone sees everything, a drop-down picks the store | Internal teams such as regional managers | Never share this with franchisees |
| One copy per location | Each report shared with its owner | Separately branded reports or a small network | Every template change is repeated for every copy |
| Copy per franchisee group | One report per owner covering their stores | Multi-unit owners who compare their own stores | Owner groups change as stores are bought and sold |
Should multi-location data run through blends or BigQuery?
Use blends for a pilot of a few locations and BigQuery for the network. Data Studio blends join at most 5 data sources with equality joins only, and they live inside one report, so a network where each location has its own analytics property or ad account outgrows them quickly.
Speed and quotas push the same way. The GA4 Data API allows 14,000 tokens per project per property per hour on standard properties, and every chart, filter change and viewer uses some of that. A report opened by dozens of franchisees on the first Monday of the month is exactly the load that triggers quota errors. Fixed-schema sources such as GA4 and Google Ads also cap a table at 10 dimensions and 20 metrics, while BigQuery tables allow 100 of each.
Moving the data into BigQuery solves all three problems. GA4 can export raw events to BigQuery, partner connectors can load ad and listing data on a schedule, and point-of-sale exports can be loaded daily. A single modelled table with one row per location per day then feeds every page, with date partitioning keeping query costs small.
Worked example: a 40-location franchise reporting dashboard
Take a home services brand with 40 locations across four regions. Each location runs local Google Ads campaigns named with its store code, has its own business listing and call tracking number, and shares one brand website where each location has a page. Sales come from a point-of-sale export per store.
On a copy-per-location model this is 40 reports, each with an ads source, an analytics source, a listing source and a sales sheet: 160 data source connections to keep working. On per-dashboard reporting software it is 40 dashboards. DashThis, for example, listed its Standard plan at 50 dashboards for $429 a month on yearly billing when we checked its pricing page in October 2026, which is $5,148 a year before any build work, and a network that passes 50 locations moves to a custom plan.
On the single-report model, the same network is one report on one modelled BigQuery table. Ads data joins on the campaign naming pattern, website data joins on the location page path, listing data joins on the listing ID, and sales join on the store code. Forty franchisees sign in and see their own store. The franchisor sees the network. Opening location 41 means adding one row to the master table.
- Network page: revenue vs target by region, same-store growth, the 5 strongest and 5 weakest locations.
- Location page: leads, calls and revenue against target, with last month and last year for comparison.
- Marketing page: spend, cost per lead and conversions by channel, filtered to the location.
- Data health page: last load date for every source, so a broken feed is visible before a franchisee notices.
Should you build in Data Studio or buy franchise reporting software?
Build in Data Studio when you need sales and operations data next to marketing data, when the network is large enough that per-dashboard pricing hurts, or when the franchisor wants to own the data model. Data Studio itself is free for creators and viewers. Data Studio Pro costs $9 per user per project per month for creators, editors and managers in Pro workspaces, and franchisees viewing reports need no licence.
Buy dedicated software when the dashboard only needs marketing channels, the team wants built-in templates with no data modelling, and the number of locations is small. Tools such as DashThis and AgencyAnalytics publish franchise pages aimed at this case, and AgencyAnalytics lists seven franchise reporting systems in its own comparison.
Do not build a franchise dashboard in Data Studio if franchisees cannot or will not sign in with the email you hold for them, since filter by email depends on it. And do not start until someone owns the location master table. Without that owner, any tool will give you the same mismatched totals.
| Your situation | Better fit | Why |
|---|---|---|
| Under 10 locations, marketing data only | Reporting software or a simple template | Little modelling, fast setup |
| 10 to 50 locations, sales plus marketing data | Data Studio on BigQuery | One report, joined data, no per-location fee |
| 50+ locations or several brands | Data Studio on BigQuery with a data health page | Per-dashboard plans run out, quotas bite |
| Agency reporting for independent franchisees | White label Data Studio templates | Separate branding and ownership per client |
What mistakes should franchisors avoid?
Most failed franchise dashboards fail on data agreements rather than design. Each of these mistakes produces totals that franchisees stop trusting, and each is cheaper to prevent than to fix later.
- Joining on location names instead of a fixed location ID, so a renamed store loses its history.
- Letting each franchisee name their own campaigns, which makes ad data impossible to assign.
- Sharing an unfiltered report with franchisees and hoping nobody opens the drop-down.
- Using the credentials of a staff member who later leaves, which breaks every chart at once.
- Showing revenue without targets, so franchisees cannot tell whether a number is good.
- Counting new locations in same-store growth before they have a full comparison year.
- Skipping a reconciliation step, so the first franchisee who checks their till report finds a gap.
How does Greenwolf Tech Labs build franchise dashboards?
We start with a free review of your locations, systems and current reports, then quote a fixed price. Our team builds the location master table first, models the data in Sheets or BigQuery depending on network size, designs the network, region and location pages, sets up filter by email, and checks totals against your point-of-sale and ad platforms before any franchisee logs in.
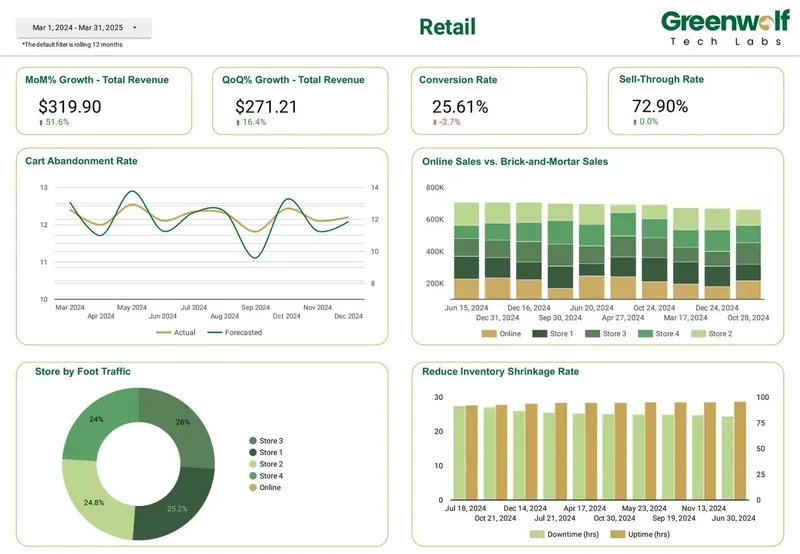
Our retail dashboards in Data Studio already track month-on-month and quarter-on-quarter revenue growth, conversion rate, online versus in-store sales and store foot traffic, which is the same shape of problem as a franchise network. Our marketing dashboards bring Google Ads, Meta, LinkedIn, GA4 and Search Console into one view.
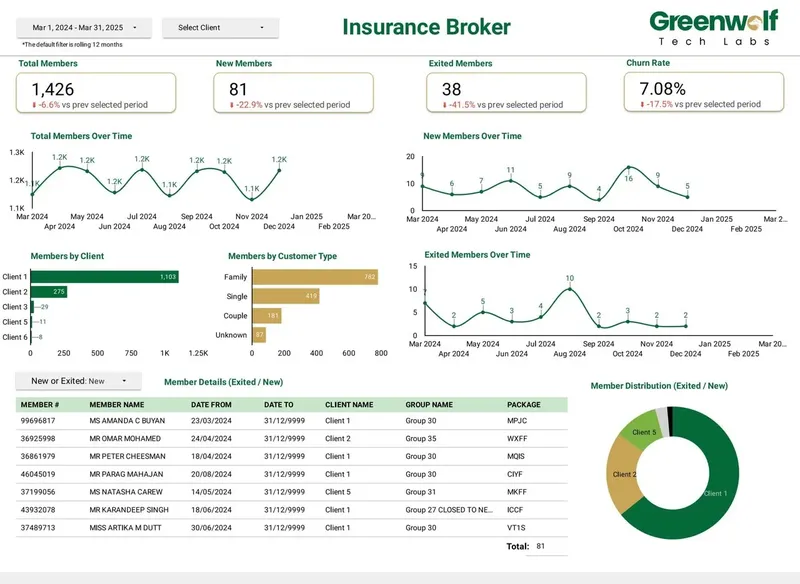
Messy inputs from many sources are familiar ground. For an Australian insurance brokerage receiving .xls files from multiple insurers, our automated pipeline cut report time from 4 to 5 hours to under 5 minutes and lifted reporting accuracy from about 75% to 99%. Franchise point-of-sale exports usually need the same kind of mapping. If your network has outgrown copied reports, send us your location list and current reports at info@greenwolftechlabs.com and we will tell you what a single franchise reporting dashboard would take.
Case study · Insurance brokerage, Australia
From 4-5 hours of spreadsheet work to a report in under 5 minutes
Monthly reports were assembled by hand from inconsistent .xls files sent by several insurers. The files now land in Google Drive, are mapped into one central sheet with the business rules applied, and feed a Data Studio dashboard.
- Report time: 4-5 hours to under 5 minutes
- Reporting accuracy: about 75% to 99%
- Visibility across insurers: limited to real time, with filters
FAQ
Frequently asked questions
What is a franchise reporting dashboard?
It is one report that shows sales, marketing and local search results for every location in a franchise network. The franchisor sees the whole network and each region, while each franchisee sees their own location. All views read from the same data, so the totals always agree.
Can franchisees see only their own location in Data Studio?
Yes. Filter by email shows each signed-in viewer only the rows that carry their email address. The email in your data must match their sign-in exactly, including capital letters, and viewers must sign in and consent before the data appears.
What KPIs should a franchisor track per location?
Most networks track revenue against target, same-store growth, leads and calls, cost per lead, local ad results and website conversions per location. Add profile actions such as calls and direction requests for service and retail brands. Keep each location page focused on what the franchisee can act on.
Can Data Studio handle 100 or more locations?
Yes, if the data sits in BigQuery rather than in live connections and blends. A single table with one row per location per day keeps the report fast and avoids GA4 quota errors. The number of viewers matters less than how the data behind the charts is modelled.
How much does franchise reporting software cost?
Many tools charge by dashboard or by client, so the bill grows with every location. DashThis listed 50 dashboards for $429 a month on yearly billing in October 2026, with custom plans above that. Data Studio is free, and Pro costs $9 per user per project per month for editors only.
Do franchisees need a Data Studio Pro licence?
No. Pro licences are only needed for creators, editors and managers in Pro workspaces. Franchisees who only view their reports need no licence, though they must sign in when filter by email is used.
How do you add Google Business Profile data to a franchise dashboard?
Google's native Data Studio connectors do not include business listings, so the data comes in through a partner connector or a scheduled load into BigQuery. Each listing is then matched to its location through the listing identifier in the location master table.
Keep reading
Related pages
Get started
Tell us what your reporting has to do
Describe the dashboards you need, who reads them and where the data sits. We reply within one business day with an approach, the connectors involved and a fixed-price plan.
- Free 30-minute reporting review
- Fixed quote before any work starts
- Everything built and owned in your Google account
Prefer email? info@greenwolftechlabs.com
Get a free proposal
Two lines is enough to start.