
Industry guide
Insurance agency marketing dashboard: from ad spend to bound and retained policies
An insurance agency marketing dashboard shows what each lead source costs, how many of its leads are contacted, quoted and bound, and how much premium those policies keep at renewal. It is for agency principals, marketing managers at brokerages and the marketing agencies that serve them. This guide covers the KPIs, the data sources including your agency management system, a worked example with numbers, privacy rules for policyholder data and how to build it in Data Studio.
Quick answer
What should an insurance agency marketing dashboard include?
An insurance agency marketing dashboard should include spend, leads, contact rate, quote rate, quote-to-bind ratio, cost per bound policy, written premium and first-renewal retention for every lead source, including purchased leads. It joins ad and website data with quote and policy records from the agency management system using a lead ID, never policyholder names.
- Judge lead sources on cost per bound policy and retained premium, not cost per lead.
- Speed to contact belongs on the marketing dashboard, because insurance leads go cold quickly.
- Your agency management system holds the outcome data; the dashboard is mostly that join.
- Keep policyholder details out of marketing views and share only aggregated counts.
What does an insurance agency marketing dashboard show?
It answers one question for the principal: which marketing produces policies that stay on the books, and at what cost. Insurance is a hard vertical for paid media, which makes that answer worth having. WordStream's 2026 Google Ads benchmarks, covering US campaigns from April 2025 to March 2026, put Finance and Insurance at an average cost per click of $9.83, a conversion rate of 2.64%, the lowest of the 23 industries measured, and a cost per lead of $74.44.
At those prices, a lead that is never called back or a policy that lapses at first renewal is expensive. Most agencies already hold the data to see this: ad platforms report spend, GA4 reports quote requests, the phone system logs calls, lead vendors send invoices, and the agency management system knows what was quoted, bound and renewed. The dashboard joins them and lays them out in five pages.
| Page | What it shows | Main reader |
|---|---|---|
| Principal overview | Spend, leads, bound policies, written premium and cost per bound policy against last month and last year | Agency principal, marketing lead |
| Lead sources | The full funnel for Google Ads, Meta, purchased leads, referrals, website and local search | Marketing team, outside agency |
| Lines of business | Funnel and cost per bound policy for auto, home, commercial, life and other lines | Principal, line managers |
| Producers and speed | Time to first contact, contact rate and quote-to-bind ratio by producer or team | Sales manager |
| Retention by source | Share of policies and premium retained at first renewal, by original lead source | Principal, account managers |
Which insurance agency KPIs belong on the dashboard?
Eight KPIs follow a prospect from first enquiry to first renewal. Define each in writing before anything is built. Agencies often disagree internally about what counts as a quote, for example a single carrier quote or a full comparative rating, and the dashboard will be argued over until that is settled.
Cost per lead is the figure lead vendors and ad platforms report, and on its own it misleads. Cheap shared leads with low contact rates can cost more per bound policy than expensive search leads, and they may also retain worse. Always show cost per bound policy and retention beside it.
| KPI | How it is calculated | What it tells you |
|---|---|---|
| Cost per lead | Spend divided by valid leads | Whether a source produces enquiries at a sensible price |
| Contact rate | Leads reached by a producer divided by valid leads | Follow-up discipline and lead quality |
| Quote rate | Leads quoted divided by leads contacted | Whether contacted prospects are actually insurable and interested |
| Quote-to-bind ratio | Policies bound divided by quotes issued | Price competitiveness and producer close skill |
| Cost per bound policy | Spend divided by policies bound | The real acquisition cost, by source and line |
| Written premium per bound policy | New premium written divided by policies bound | Which sources bring the policies worth writing |
| First-renewal retention | Policies renewed at first term divided by policies due | Whether a source brings customers who stay |
| Speed to contact | Median minutes from lead arrival to first producer attempt | How much paid demand goes cold before anyone calls |
Which data sources feed an insurance marketing dashboard?
Data Studio connects natively to Google Ads, GA4, Search Console, Google Sheets and BigQuery, which covers paid search, website quote requests and organic search at no software cost. Meta and other platforms need a partner connector from vendors such as Supermetrics, Windsor.ai, Porter Metrics, Funnel, Power My Analytics or Catchr, or a scheduled export.
The outcome data lives in your agency management system, such as Applied Epic, AMS360, HawkSoft or EZLynx, or in a CRM layered on top. These systems are rarely connected to Data Studio directly. The practical route is a scheduled report export into Google Drive or BigQuery, containing a lead or policy ID, dates, source, line of business, status and premium, which is then mapped into a clean table.
- Google Ads and GA4: spend, quote form submissions and calls from ads, via native connectors.
- Meta and other social ads: spend and lead form submissions, via a partner connector.
- Purchased lead vendors: lead counts and costs from vendor invoices or portal exports, loaded into a Sheet.
- Phone system or call tracking: every inbound call with source, time and answered or missed status.
- Agency management system or CRM: contacted, quoted, bound, premium and renewal status, via scheduled export keyed on an ID.
- Carrier reports: commission and policy status files where your AMS does not hold them, mapped into the same structure.
- Referrals and walk-ins: a simple Sheet with fixed dropdowns for source names, updated by the front desk.
Insurance agency marketing dashboard example with real arithmetic
The figures below are illustrative, not benchmarks. They show why cost per lead alone points an agency in the wrong direction.
A personal lines agency spends $8,000 in a month. Google Ads takes $5,000 and produces 70 leads, a cost per lead of about $71. Producers reach 50 of them, quote 32 and bind 10, so cost per bound policy is $500. Average annual premium on those policies is $1,600, so the month's search spend writes $16,000 of new premium.
Purchased shared leads take the other $3,000 and produce 150 leads at $20 each, which looks far cheaper. Producers reach 75, quote 36 and bind 6. Cost per bound policy is also $500, but average premium is $1,200, so the spend writes $7,200. If the dashboard's retention page then shows that fewer of the purchased-lead policies survive their first renewal, the case for moving budget to search, or for calling purchased leads faster, becomes clear. The point is not that one source always wins. It is that only a joined view shows the difference.
| Source | Spend | Leads | Bound | Cost per bound policy | Premium written |
|---|---|---|---|---|---|
| Google Ads | $5,000 | 70 | 10 | $500 | $16,000 |
| Purchased leads | $3,000 | 150 | 6 | $500 | $7,200 |
| Total | $8,000 | 220 | 16 | $500 | $23,200 |
Why should speed to contact sit on the marketing dashboard?
Because in insurance much of the marketing budget is won or lost after the lead arrives. A shopper asking for a quote has usually asked other agencies and comparison sites at the same time. If your producer calls the next morning, the spend that bought that lead may already be wasted, and no change to bids or ad copy will fix it.
Put speed to contact and contact rate on the same page as spend, split by source and by producer. When a principal sees that one source's leads wait hours for a first call while another's are reached in minutes, the conversation moves from marketing to process. That conversation usually saves more money than any channel change.
The data usually exists already. The lead arrival time comes from the form, the vendor feed or the phone system, and the first contact attempt from the CRM activity log or call records. The work is matching the two on the lead ID.
How do you keep policyholder data safe in a marketing dashboard?
Keep identities out of it. Agencies hold sensitive personal and financial information, and privacy rules apply to it, such as the Gramm-Leach-Bliley Act in the US and GDPR for European policyholders. A dashboard shared with an outside marketing agency is the wrong place for names, addresses, dates of birth or claims history.
The dashboard does not need them. It needs counts and sums: leads, quotes, bound policies, premium and renewals by source, line and month. Build the AMS export with only IDs, dates, source, line, status and premium. Aggregate in BigQuery or a restricted Sheet and connect Data Studio only to the aggregated table.
Two Data Studio settings matter. Data source credentials decide whether viewers see data through the owner's access or their own, so set them on purpose. And share reports with named accounts, not anyone with the link. Your compliance lead should approve the field list before launch.
How do you build an insurance agency marketing dashboard in Data Studio?
In six steps, with most of the effort in the data rather than the charts. Agencies that try to build it directly on live connectors usually stall at the AMS join or at messy carrier files.
Messy files are common in insurance. For an Australian insurance brokerage that received inconsistent .xls files from multiple insurers, our team automated the pipeline: files land in Google Drive, are mapped into a central Google Sheet, have business rules applied, and feed the dashboard. Report preparation fell from 4 to 5 hours to under 5 minutes, and reporting accuracy rose from about 75% to 99%.
- Agree definitions: valid lead, contact, quote, bind and renewal, signed off by the principal and sales manager.
- Fix capture: UTM fields in quote forms, source on every call, and a required lead source field in the AMS or CRM.
- Create the ID: generate a lead ID at first contact and carry it through quote and policy records.
- Model the data: land ad, vendor, call and AMS exports in Sheets or BigQuery and join them on the ID; Data Studio blends allow only five sources and equality joins.
- Build and reconcile: create the five pages, then check bound counts and premium against the AMS and spend against invoices.
- Hand over: document calculated fields, transfer ownership to agency accounts and schedule a monthly email to the principal.
AMS reports, an insurance CRM or a custom Data Studio dashboard?
Agencies usually compare three options. The right one depends on how much you spend on paid and purchased leads and whether you need marketing and policy outcomes in one view.
| Option | Strength | Limitation | Best fit |
|---|---|---|---|
| Agency management system reports | Accurate on policies, premium and renewals | Little or no ad spend, website or vendor cost data | Referral-led agencies with little paid marketing |
| Insurance CRM or marketing automation dashboards | Producer activity, pipelines and email campaigns in one tool | Usually weak on multi-platform ad spend and cost per bound policy | Agencies focused on cross-selling and renewals |
| Custom Data Studio dashboard | Joins ad spend, lead vendors, calls and AMS outcomes, free to share | Needs an ID scheme, a build and someone to maintain connectors | Agencies spending meaningfully on search, social or purchased leads |
What mistakes do agencies make with marketing dashboards?
These show up in most first attempts. Each makes the dashboard look full while hiding the number the principal needs.
- Comparing lead sources on cost per lead instead of cost per bound policy and retained premium.
- Leaving purchased lead costs out because they arrive as invoices, not through an API.
- Letting producers type free-text sources, so one channel appears under five names.
- Mixing personal and commercial lines, so large commercial premiums hide weak personal lines results.
- Pulling policyholder names or contact details into a shared report.
- Running many viewers on live GA4 connections, which can hit the 14,000 tokens per property per hour quota on standard properties.
How Greenwolf Tech Labs builds insurance marketing dashboards
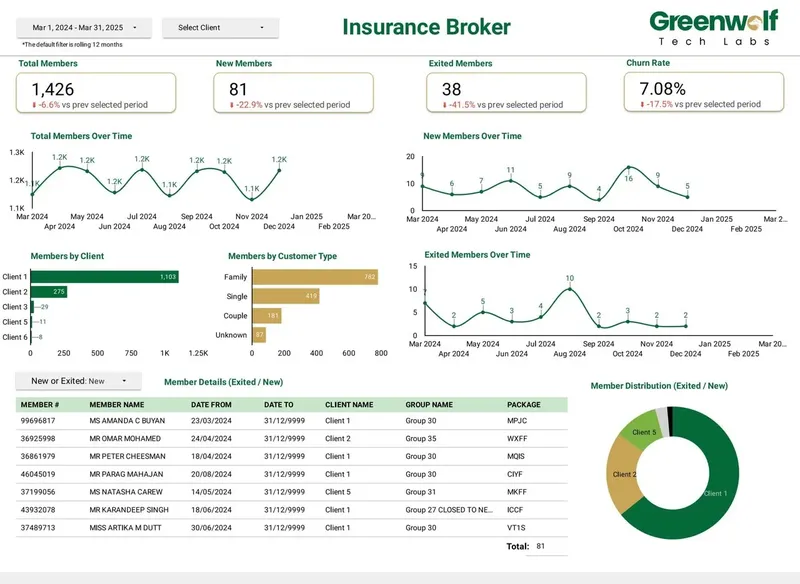
Insurance is one of our core industries. We have built an insurance broker dashboard in Data Studio that tracks members joined, exited and retained, and churn rate by client scheme and customer type, refreshed from the policy administration export instead of rebuilt in a spreadsheet each month. The same approach, applied to marketing, links each lead source to bound policies and renewals.
Our team starts with a free review of your ad accounts, lead vendors, phone system and AMS exports, agrees the definitions with your principal and sales manager, then designs the ID and source mapping before any chart is drawn. For marketing agencies with several insurance clients, we can deliver the dashboard as a white-label template branded for each client. We quote a fixed price after the review, and if your AMS cannot yet tie policies to lead sources, we will say so and suggest what to capture first.
Case study · Insurance brokerage, Australia
From 4-5 hours of spreadsheet work to a report in under 5 minutes
Monthly reports were assembled by hand from inconsistent .xls files sent by several insurers. The files now land in Google Drive, are mapped into one central sheet with the business rules applied, and feed a Data Studio dashboard.
- Report time: 4-5 hours to under 5 minutes
- Reporting accuracy: about 75% to 99%
- Visibility across insurers: limited to real time, with filters
FAQ
Frequently asked questions
What KPIs should an insurance agency track for marketing?
Track cost per lead, contact rate, quote rate, quote-to-bind ratio and cost per bound policy for each lead source and line of business. Add written premium per bound policy, first-renewal retention and speed to contact. Cost per bound policy and retained premium are the most useful numbers for a principal.
What is a good quote-to-bind ratio for an insurance agency?
It varies widely by line of business, market, carrier appetite and lead source, so a single benchmark is not reliable. What matters is tracking it consistently by source and producer, and watching the trend. A source with a falling ratio usually signals poor lead fit or slow follow-up.
Can Google Data Studio connect to Applied Epic, AMS360 or HawkSoft?
Usually not directly. The practical route is a scheduled report export from the agency management system into Google Drive, Sheets or BigQuery, which Data Studio then reads. Keep the export to IDs, dates, source, line, status and premium, with no policyholder details.
How much do insurance leads cost on Google Ads?
WordStream's 2026 Google Ads benchmarks, based on US campaigns from April 2025 to March 2026, report an average cost per lead of $74.44 for Finance and Insurance, with a $9.83 average cost per click. Your own cost depends on line, location and competition, which is why the dashboard should track it by source and line.
Should purchased leads be on the same dashboard as ad leads?
Yes. Purchased leads are often a large share of spend, and they look cheap on cost per lead. Putting them through the same funnel shows their true cost per bound policy and how well those policies renew. Load vendor invoices or portal exports into a Sheet so their cost is counted.
Can a marketing agency white-label this dashboard for insurance clients?
Yes. A Data Studio template can be copied for each insurance client with the agency's branding and each client's own data sources. Each copy still needs its own credentials, source mapping and checks, which is the work a white-label reporting partner handles.
How much does an insurance agency marketing dashboard cost?
Data Studio itself is free, and Data Studio Pro is $9 per user per project per month if you need team workspaces. Partner connectors are priced by their vendors. The build cost depends on how many sources you have and how clean the AMS data is, so we quote a fixed price after a free review.
Keep reading
Related pages
Get started
Tell us what your reporting has to do
Describe the dashboards you need, who reads them and where the data sits. We reply within one business day with an approach, the connectors involved and a fixed-price plan.
- Free 30-minute reporting review
- Fixed quote before any work starts
- Everything built and owned in your Google account
Prefer email? info@greenwolftechlabs.com
Get a free proposal
Two lines is enough to start.