
Comparison
Data Studio vs Tableau: which should your team pay for in 2026?
Data Studio vs Tableau comes down to one trade: Data Studio is free and built for sharing reports on Google and SQL data, while Tableau is a paid, per-seat analytics platform built for deep visual analysis by trained analysts. This guide is for marketing teams, agencies and finance or operations leads who are renewing Tableau, starting fresh, or trying to cut reporting cost. Our team builds Data Studio dashboards and migrates reports from other tools, so we have written down what actually changes when you pick one over the other.
Quick answer
Is Data Studio better than Tableau?
Data Studio is better when you need low-cost, widely shared reports on Google, marketing or SQL data, because building and viewing is free and Pro costs $9 per user per project per month. Tableau is better for heavy visual analysis by trained analysts, with list prices from $15 to $115 per user per month billed annually.
- Data Studio is free to build and view; Tableau charges every named user, viewers included.
- A 5-author, 40-viewer team pays roughly $11,700 a year at Tableau Standard list prices.
- Tableau wins on visual depth, extracts and in-tool modelling; Data Studio wins on cost and sharing.
- Most Tableau-to-Data Studio moves succeed when modelling shifts into BigQuery first.
Data Studio vs Tableau: what is the real difference?
The real difference is who each tool is built for. Data Studio is Google's browser-based reporting tool, designed so that anyone with a link can read a live report and anyone with edit rights can add a chart. Tableau, owned by Salesforce, is an analytics platform designed for analysts who author in Tableau Desktop or the web editor, prepare data in Tableau Prep, and publish to Tableau Cloud or a self-hosted Tableau Server.
That design choice shows up everywhere else: in pricing, in how data is shaped, in how many people can read a report without a licence, and in how long it takes a new hire to become useful. Tableau gives an analyst more control over every mark on a chart. Data Studio gives a team more reports in more hands for less money.
One naming note before comparing. Google renamed Looker Studio back to Data Studio in April 2026, so most "Looker Studio vs Tableau" articles you will find are describing the same product under its old name. Existing reports moved over automatically. Data Studio is also not the same as Looker, which is Google's separate enterprise BI platform with its own semantic modelling layer. If a comparison quotes Looker pricing, it is answering a different question.
How do Data Studio and Tableau compare side by side?
The table summarizes the factors that decide most projects we scope. Tableau prices are list prices for Tableau Cloud as published by Tableau and summarized in Knowi's 2026 Tableau pricing guide; negotiated contracts can differ, so confirm with Salesforce before budgeting.
| Factor | Data Studio | Tableau |
|---|---|---|
| Licence model | Free for creators and viewers. Pro is $9 per user per project per month, and viewers never need a licence | Per named user, billed annually. Standard: Creator $75, Explorer $42, Viewer $15. Enterprise: Creator $115, Explorer $70, Viewer $35 |
| Minimum to start | A Google account | At least one Creator licence per deployment |
| Where it runs | Browser only, hosted by Google | Tableau Cloud (hosted) or Tableau Server (self-hosted), with Desktop for authoring |
| Native connectors | GA4, Google Ads, Search Console, Sheets, BigQuery, YouTube, CM360, DV360, Ad Manager, Cloud SQL, MySQL, PostgreSQL, SQL Server, Redshift, plus hundreds of partner connectors | Broad library of database, file and SaaS connectors, strong on warehouses and enterprise systems |
| Data shaping | Calculated fields, CASE statements, parameters, blends of up to 5 sources with equality joins | Relationships, joins, level-of-detail expressions, extracts and Tableau Prep flows |
| Visual depth | Standard business charts, maps, histograms and tables; bulk styling added September 2026 | Very fine control over marks, layers and custom chart types |
| Sharing | Link sharing like Google Docs, scheduled email; Pro adds Slack and Google Chat delivery and up to 200 schedules per report | Licensed users on Cloud or Server; subscriptions and embedding |
| Natural-language questions | Conversational Analytics, generally available since July 30, 2026, using data agents built in BigQuery | AI features sold through Tableau+ with pricing usually by sales quote |
| Learning curve | Low for report readers and builders | Steeper; analysts usually need formal training |
Data Studio vs Tableau cost: a worked example
Licence cost is where the two tools separate most sharply, because Tableau charges every person who opens a report and Data Studio charges nobody for viewing. Take a common setup we see in mid-size companies: 5 people who build and edit reports, and 40 managers who read them.
On Tableau Standard list prices that is 5 Creators at $75 and 40 Viewers at $15, or $975 a month and $11,700 a year. If those 40 managers need to build their own views rather than only read, they become Explorers at $42, and the total rises to $2,055 a month, or $24,660 a year. On Tableau Enterprise the original 5-and-40 split costs $1,975 a month, or $23,700 a year.
The same team on Data Studio pays nothing in licences. If they want company-owned content, team workspaces and hourly scheduling, they buy Data Studio Pro for the 5 builders only: 5 x $9 = $45 a month per Google Cloud project, or $540 a year. The 40 readers stay free.
Licences are not the whole bill. Data Studio teams often pay for partner connectors to bring in Meta, LinkedIn or CRM data, and for BigQuery storage and queries once data outgrows live connectors. Tableau teams pay for hosting if they run Server, and for analyst time, since Tableau work usually needs more specialist hours. Even so, when most users only read reports, the viewer licence line is usually the number that decides the question.
| Scenario (5 builders, 40 readers) | Monthly licence cost | Annual licence cost |
|---|---|---|
| Tableau Standard, readers as Viewers | $975 | $11,700 |
| Tableau Standard, readers as Explorers | $2,055 | $24,660 |
| Tableau Enterprise, readers as Viewers | $1,975 | $23,700 |
| Data Studio free edition | $0 | $0 |
| Data Studio Pro for the 5 builders, one project | $45 | $540 |
Where does Tableau beat Data Studio?
Tableau is the stronger choice when the work is analysis rather than reporting. If your analysts spend their day slicing a large dataset in new ways, building cohort views, layering reference lines and testing hypotheses visually, Tableau gives them more control than Data Studio will.
It also handles heavier in-tool data shaping. Level-of-detail expressions, multi-table relationships and extracts let a Tableau author do work inside the tool that a Data Studio builder would push down into BigQuery or a SQL view. And because extracts are snapshots, Tableau dashboards on large data can stay fast without querying the source on every click.
- Analyst teams doing exploratory work on large, multi-table datasets.
- Organizations already on Salesforce, where Tableau sits inside an existing contract.
- Reporting that needs bespoke chart types Data Studio does not offer.
- Companies with a trained Tableau team and years of published workbooks they rely on.
Where does Data Studio beat Tableau?
Data Studio wins when reports must reach many people cheaply and the data lives in Google products or SQL databases. Marketing reporting is the clearest case: GA4, Google Ads, Search Console, YouTube, CM360 and DV360 all connect natively, so a channel report can be working in the first session.
It is also the practical choice for agencies. A marketing agency reporting to 30 clients under Tableau's per-user model would usually need a licence for each named client user who logs in. In Data Studio, each client opens a branded report by link or receives it by scheduled email at no licence cost, which is why so much white-label client reporting runs on it.
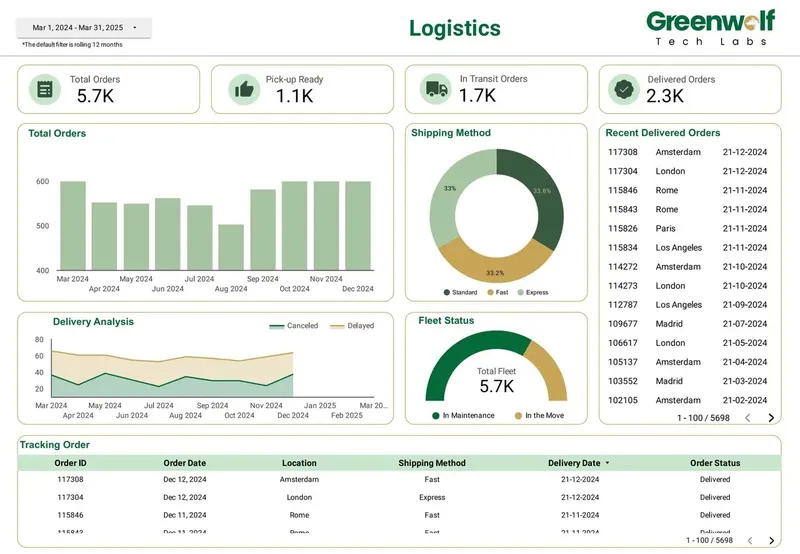
The operational dashboards we build show the same pattern outside marketing. A logistics team tracking orders by stage, shipping method mix, delayed and cancelled deliveries and fleet status, or a procurement team tracking spend by category and country, supplier lead times and suppliers at risk, needs dozens of people to read one live view. Paying a seat for each of them rarely makes sense.
- Marketing and paid media reporting on Google sources plus partner connectors.
- White-label client reports where every client must see their own data for free.
- Operations dashboards read by large teams, store managers or field staff.
- Teams whose data already sits in BigQuery or Google Sheets.
What Data Studio limits should Tableau users know about?
Tableau authors moving to Data Studio usually hit the same handful of limits, and every one has a known workaround. Knowing them in advance is the difference between a smooth switch and a report that looks finished but breaks in its first week.
The common thread is that Data Studio expects the data to arrive shaped. Logic that a Tableau author keeps in calculated fields, LOD expressions or Prep flows belongs in BigQuery views or scheduled queries when you move. Partitioning those tables by date keeps query costs and load times low.
- Blends join a maximum of 5 data sources and support equality joins only. Wider models belong in BigQuery.
- Tables on fixed-schema sources such as GA4 and Google Ads are capped at 10 dimensions and 20 metrics; flexible-schema sources such as Sheets, BigQuery and SQL allow 100 of each.
- The GA4 Data API allows 14,000 tokens per project per property per hour on standard properties, so busy GA4 reports hit quota errors. Extracts or a BigQuery export fix this.
- Very large queries can return too many rows errors, which aggregation in the source avoids.
- There is no built-in row-level security rule. Restricting data per viewer uses viewer's credentials, separate data sources or filtering in BigQuery.
- Data Studio gives no warning when a connector breaks, so someone has to monitor scheduled reports.
How do you migrate from Tableau to Data Studio?
A Tableau to Data Studio migration is a rebuild, not a file conversion. There is no import for Tableau workbooks, so the work is to recreate the logic in the right layer and then rebuild the pages. The process below is the one our team follows on migration projects.
Expect the data layer to take more effort than the pages. Once metrics are defined in BigQuery and reconciled to the totals the business already trusts, rebuilding charts in Data Studio is usually the faster half of the job.
| Tableau element | Where it goes in Data Studio |
|---|---|
| Extracts (.hyper) | BigQuery tables refreshed by scheduled queries, or Data Studio extracts for small sources |
| Tableau Prep flows | BigQuery views or scheduled SQL |
| Calculated fields | Data Studio calculated fields and CASE statements, or SQL in the view |
| LOD expressions | Pre-aggregated BigQuery tables or window functions |
| Relationships across many tables | Joined BigQuery views; blends only for up to 5 sources |
| User filters and row-level rules | Viewer's credentials, per-audience data sources or BigQuery filtering |
| Subscriptions | Scheduled email delivery; Slack and Google Chat in Pro |
Should you switch from Tableau, or keep both?
Do not switch everything just because Data Studio is free. If your analysts rely on Tableau for exploratory work and you have years of trusted workbooks, a full move can cost more in rebuild time and lost capability than it saves in licences.
The pattern we usually recommend is a split. Keep a small number of Tableau Creator seats for the analysts who need them, and move the widely read operational, marketing and client reports to Data Studio, where readers cost nothing. Define shared metrics once in BigQuery so revenue, spend and margin match in both tools.
Switching fully makes sense when most Tableau seats are Viewers, when renewal is close, and when the data already lives in Google Cloud or SQL. Staying fully on Tableau makes sense when nearly every user is an analyst and the organization runs on Salesforce.
- Count your Tableau seats by role. A Viewer-heavy mix points to Data Studio.
- List the workbooks people actually opened in the last 90 days. Migrate those, retire the rest.
- Check where the data lives. Google Cloud and SQL sources favor Data Studio.
- Check your renewal date and give a migration at least one reporting cycle of parallel running.
How does Greenwolf Tech Labs help teams decide?
We start with a free review of your current reports, seat counts and data sources, then recommend one tool, the other, or a split, with a fixed-price quote for any build or migration. Our team has delivered 100+ projects for 200+ clients across marketing, finance, retail, manufacturing, logistics, insurance and pharma reporting.
Where a migration makes sense, we model the data in BigQuery, rebuild the reports in Data Studio, reconcile every headline figure against the old Tableau numbers, and run both side by side until your team signs off.
FAQ
Frequently asked questions
Is Data Studio as good as Tableau?
For sharing reports on Google, marketing and SQL data, Data Studio is usually good enough and far cheaper, since building and viewing are free. For deep exploratory analysis and complex in-tool modelling, Tableau is more capable. The right answer depends on whether your users mostly read reports or mostly analyze data.
How much does Tableau cost compared to Data Studio?
Tableau's published list prices run from $15 per Viewer to $115 per Enterprise Creator per user per month, billed annually, and every deployment needs at least one Creator. Data Studio is free for creators and viewers, and Data Studio Pro costs $9 per user per project per month for builders only.
Is Looker Studio the same as Data Studio?
Yes. Google renamed Looker Studio back to Data Studio in April 2026, and existing reports moved over automatically. It is a different product from Looker, Google's enterprise BI platform, so check which one a comparison is describing.
Can I convert Tableau dashboards to Data Studio?
Not automatically. There is no import for Tableau workbooks, so the logic is rebuilt, usually by moving extracts, Prep flows and LOD calculations into BigQuery and then recreating the pages in Data Studio. Reconciling totals against the old dashboards before switching off Tableau is essential.
Which is better for marketing agencies, Tableau or Data Studio?
Data Studio is usually the better fit. It connects natively to GA4, Google Ads and Search Console, and clients can view branded reports without a licence. Under Tableau's per-user model, client logins typically add seat costs as the client list grows.
Does Data Studio handle large datasets like Tableau?
Data Studio relies on its source for scale. Connected to partitioned BigQuery tables it handles large data well, while direct connectors face limits such as GA4 API quotas and too many rows errors. Tableau can cache large data in extracts inside the tool.
Can a company run Tableau and Data Studio together?
Yes, and it is often the most cost-effective setup. Analysts keep Tableau Creator seats for exploration, while widely read reports move to Data Studio. Defining shared metrics once in BigQuery keeps the numbers consistent across both.
Keep reading
Related pages
Get started
Tell us what your reporting has to do
Describe the dashboards you need, who reads them and where the data sits. We reply within one business day with an approach, the connectors involved and a fixed-price plan.
- Free 30-minute reporting review
- Fixed quote before any work starts
- Everything built and owned in your Google account
Prefer email? info@greenwolftechlabs.com
Get a free proposal
Two lines is enough to start.