
Buyer's guide
Data visualization agency: which kind you need and how to hire one
A data visualization agency turns your numbers into charts, dashboards or visual stories, but the phrase covers two very different businesses: design studios that produce one-off visuals and dashboard agencies that build live reporting connected to your systems. This guide is for marketing leads, agency owners and finance or operations managers who are about to hire one. It explains how to tell the two apart, what a good engagement delivers, how the work runs week by week, and the questions that expose a weak supplier before you sign.
Quick answer
What does a data visualization agency do?
A data visualization agency designs and builds visual views of your data. Design-led studios make infographics, reports and interactive stories from a fixed dataset. Dashboard agencies connect to live sources such as GA4, ad platforms, CRMs, spreadsheets and warehouses, model the data, and build reports in tools like Data Studio that refresh on their own.
- Decide first whether you need a one-off visual story or live, refreshing dashboards.
- Most of a dashboard agency's work happens in the data before any chart appears.
- Insist that reports and data sources are owned by your account from day one.
- Ask how totals are reconciled against source systems before you judge the design.
What does a data visualization agency actually do?
A data visualization agency takes data you already have and makes it readable for a specific audience. The deliverable can be a static infographic, an annual report, an interactive web graphic or a dashboard that a team opens every morning. What separates a good agency from a design shop with a chart library is that it understands the data well enough to choose what to show and what to leave out.
Column Five, a content agency, makes the same point in its guide to choosing a visualization agency (last updated in 2024): a strong visualization partner digs into the data to find the insight, not only the colour palette. For live reporting the bar is higher still, because the agency also has to make the data arrive correctly every day without anyone touching it.
That is why the first question to answer is not which agency, but which kind of agency.
Design studio or dashboard agency: which kind of data visualization agency do you need?
Most confusion in this market comes from one label covering two trades. A design-led studio is the right hire when the data is fixed and the goal is persuasion: a research report, a pitch, a public campaign or an investor story. A dashboard agency is the right hire when the data changes daily and the goal is a decision: which campaign to cut, which supplier is late, which store is missing forecast.
Page one of search results mixes both. Fuselab Creative, for example, presents itself as a design-led data visualization agency for complex products and applications, while the AgencyAnalytics guide on the same phrase is really a list of reporting tools. Read any agency's portfolio with the table below in mind, and you will know within a few minutes whether it builds what you need.
| Question | Design-led studio | Dashboard agency |
|---|---|---|
| Typical output | Infographics, reports, interactive stories, motion graphics | Live dashboards, scheduled reports, client portals |
| Data | A fixed dataset you hand over | Connected sources that refresh: GA4, ads, CRM, Sheets, BigQuery |
| Core skill | Information design and storytelling | Data modelling, connectors, calculated fields, reconciliation |
| Tools | Illustrator, Figma, D3.js, custom code | Data Studio, Power BI, Tableau, SQL, warehouses |
| After launch | Usually finished | Needs monitoring as platforms change fields and quotas |
| Best for | Campaigns, research, investor and public audiences | Marketing, finance, operations and agency client reporting |
What should a dashboard-focused data visualization agency deliver?
A dashboard engagement should end with more than pages of charts. You are paying for a working reporting system that someone else can maintain, so the handover matters as much as the screens.
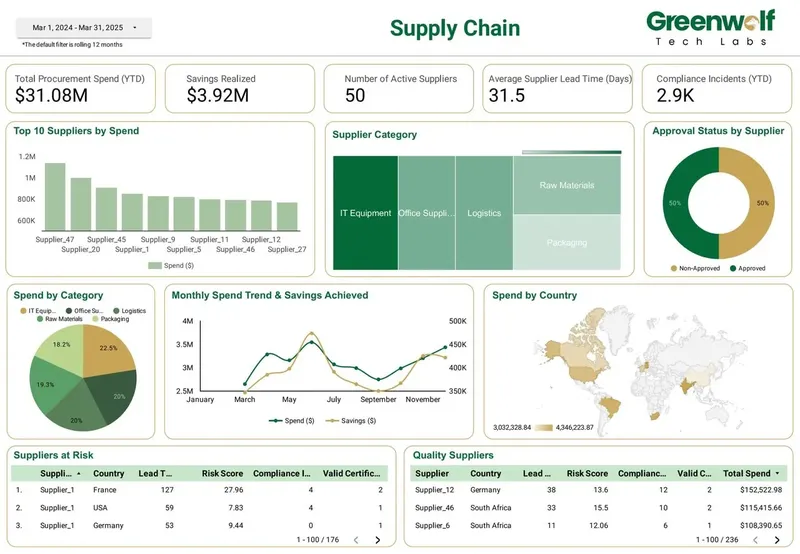
As an example of scope, a supply chain and procurement dashboard our team built in Data Studio shows total procurement spend, savings realized, active suppliers, average supplier lead time, compliance incidents, top suppliers by spend, spend by category and by country, suppliers at risk and approval status. Each of those numbers needs an agreed definition, a source field and a test before it reaches a chart, and the deliverables list should reflect that.
- A metric dictionary: every KPI, its formula and its source field, in plain language.
- Connected data sources, using native connectors where they exist and partner connectors where they do not.
- A data model: blends, Sheets mapping tables or BigQuery tables, depending on volume and complexity.
- Report pages with filters, date controls, drill-downs and parameters agreed in the brief.
- A reconciliation note showing dashboard totals matched against the source systems.
- Ownership of reports and data sources transferred to your company account.
- Documentation of calculated fields, CASE logic and credentials, plus a recorded walkthrough.
How does a data visualization project run, step by step?
A well-run project follows the same order every time: decisions first, data second, design last. Agencies that start with mockups usually discover the data problems in week three and the timeline slips.
On timing, Fuselab Creative's own FAQ says medium-complexity visualization work takes weeks rather than months, and that matches how dashboard work usually behaves. The variable is not the number of charts, it is how clean the sources are. A dashboard on native GA4 and Google Ads data moves quickly. One built on spreadsheets exported by hand from several systems takes longer, because the mapping rules have to be written and tested first.
- Discovery: list the decisions the dashboard supports, the audience and the five to ten KPIs that matter.
- Data audit: inspect a sample of each source, check field names, date formats and IDs that need mapping.
- Modelling: connect sources, build calculated fields, and decide between blends, Sheets and BigQuery.
- Wireframe: agree page structure and filters on a low-fidelity layout before styling anything.
- Build: create pages, apply the brand theme, and set sharing and scheduled delivery.
- Reconcile: compare totals with the source platforms and document any accepted differences.
- Handover: transfer ownership, document the logic and train the people who will use it.
Which tool should a data visualization agency build in?
Choose the tool that matches where your data lives and who will read the reports, not the one the agency happens to prefer. A good agency will explain the trade-off rather than default to its favourite.
Data Studio (formerly Looker Studio, renamed back in April 2026) is free for creators and viewers, connects natively to GA4, Google Ads, Search Console, Sheets and BigQuery, and shares reports with a link, which suits marketing teams and agencies reporting to clients. Its limits are real: blends join at most five sources, fixed-schema sources such as GA4 cap a table at 10 dimensions and 20 metrics, and GA4 API quotas can throw errors when many charts and viewers hit one property. The product keeps moving too. Google's release notes added a Union merge for blends on November 5, 2026, which appends rows from up to five tables, and BigQuery Graph support on October 22, 2026.
Power BI and Tableau suit organisations already standardised on Microsoft or Salesforce, or those needing heavy desktop modelling. Custom D3.js or web builds suit public, high-traffic or highly bespoke visuals where licence cost per viewer matters less than design freedom. Our comparisons of Data Studio with Power BI and with Tableau go deeper on each.
What questions should you ask a data visualization agency before hiring?
The fastest way to judge an agency is to ask about the data, not the design. Polished portfolios are easy to assemble. A clear answer on reconciliation and ownership is much harder to fake.
- Can you show a dashboard you built that refreshes from live sources, not a static mockup?
- Who will own the reports, data sources and any connector accounts when the project ends?
- How do you check that dashboard totals match GA4, the ad platforms or the finance system?
- Which partner connectors will we need, and who pays for them?
- What happens when a connector breaks or a platform deprecates a field?
- Who on your team does the data modelling, and who does the design?
- What will you need from our side each week, and from whom?
What are the red flags when choosing a data visualization agency?
Most failed dashboard projects show warning signs in the proposal. Watch for these before you sign, because each one tends to become a cost later.
- A proposal that lists pages and chart types but says nothing about data preparation.
- Reports built in the agency's own account with only view access for you.
- No reconciliation step, so nobody can say whether the numbers are right.
- Heavy reliance on blends for a model that clearly needs a warehouse.
- A portfolio of design samples with no live dashboards connected to real sources.
- No plan for monitoring, even though Data Studio gives no warning when a connector breaks.
When do you not need a data visualization agency?
You may not need an agency at all if your reporting fits inside a single platform's built-in dashboards and nobody asks for numbers across tools. A small team reading only GA4, or only its CRM, can often get by with the native reports and a free template.
A single independent specialist can also be the better hire for one well-defined report or a quick fix to an existing one. An agency earns its fee when the work spans several sources, several audiences or ongoing change: new clients to onboard, new pages each quarter, connectors to watch and stakeholders asking why a figure moved.
How Greenwolf Tech Labs works as a data visualization agency
We are a dashboard agency, not a design studio. Our team builds live reporting in Data Studio for marketing agencies, ecommerce brands and finance and operations teams, with the data work done before the design. Dashboards we have built include marketing views across Google Ads, Meta, LinkedIn, GA4 and Search Console, retail growth and sell-through reporting, logistics order tracking, manufacturing loss analysis and pharma brand performance.
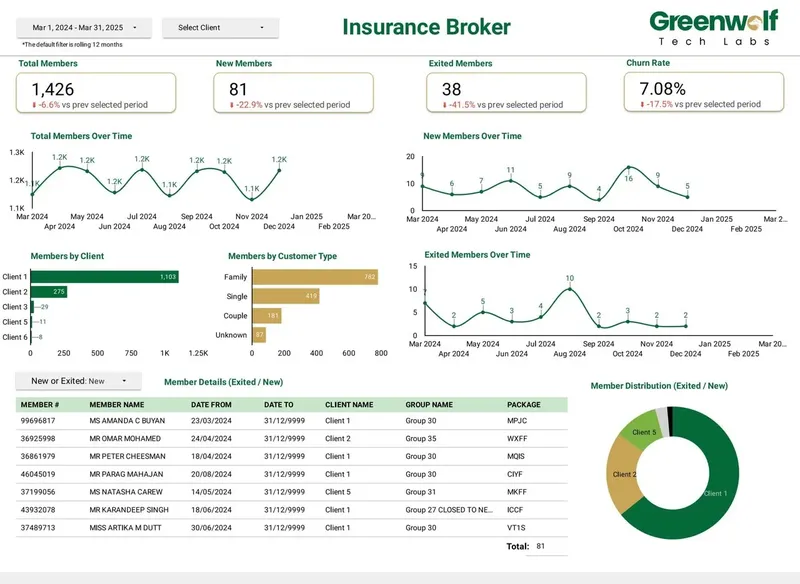
For an Australian insurance brokerage receiving messy .xls files from several insurers, we automated the pipeline from Google Drive through a central Google Sheet with business rules into the dashboard. Report preparation fell from 4 to 5 hours to under 5 minutes, and reporting accuracy rose from about 75% to 99%.
We quote a fixed price after a free review of your sources and goals. Across 8+ years we have delivered 100+ projects for 200+ clients in 50+ locations, working remotely from offices in India and the USA.
Case study · Insurance brokerage, Australia
From 4-5 hours of spreadsheet work to a report in under 5 minutes
Monthly reports were assembled by hand from inconsistent .xls files sent by several insurers. The files now land in Google Drive, are mapped into one central sheet with the business rules applied, and feed a Data Studio dashboard.
- Report time: 4-5 hours to under 5 minutes
- Reporting accuracy: about 75% to 99%
- Visibility across insurers: limited to real time, with filters
FAQ
Frequently asked questions
What is the difference between a data visualization agency and a BI consultant?
A data visualization agency is a team that usually handles design, data modelling and ongoing support together. A BI consultant is often one specialist focused on the data model and tool setup. Agencies suit multi-source, ongoing work, while a single consultant suits a defined build or a fix.
How long does it take a data visualization agency to build a dashboard?
Fuselab Creative's FAQ describes medium-complexity work as taking weeks rather than months, and dashboard work behaves similarly. The schedule depends mostly on data quality: clean native connectors move fast, while hand-exported spreadsheets need mapping rules written and tested first.
How much does a data visualization agency cost?
It depends on the number of sources, the state of the data, the page count and whether a warehouse is needed. Most dashboard agencies quote per project, per month for ongoing work, or per client for white-label reporting. Our Data Studio agency pricing guide explains each model and how to compare quotes.
Should a data visualization agency use Data Studio, Power BI or Tableau?
Use the tool that fits your data and audience. Data Studio is free and strongest with Google sources and link-based client sharing. Power BI and Tableau fit organisations already standardised on Microsoft or Salesforce or needing heavy desktop modelling.
Who should own the dashboards a data visualization agency builds?
Your company should. Ask for reports, data sources and connector accounts to be created in or transferred to your own account, with the agency added as an editor. That way you keep everything if the relationship ends.
Can a data visualization agency build white-label dashboards for my clients?
Yes, if it is a dashboard agency. White-label work means building reports under your brand that you send to your clients, then onboarding each new client, checking credentials and monitoring connectors. Data Studio has no built-in client management, so the agency's process matters.
Keep reading
Related pages
Get started
Tell us what your reporting has to do
Describe the dashboards you need, who reads them and where the data sits. We reply within one business day with an approach, the connectors involved and a fixed-price plan.
- Free 30-minute reporting review
- Fixed quote before any work starts
- Everything built and owned in your Google account
Prefer email? info@greenwolftechlabs.com
Get a free proposal
Two lines is enough to start.