
Industry guide
Restaurant marketing dashboard: connect marketing to covers, orders and sales
A restaurant marketing dashboard shows a restaurant group, or the agency that markets it, which channels bring in reservations, online orders and walk-in visits, and what each one costs. This guide is for marketing managers at multi-location restaurants, franchise marketing teams and agencies with hospitality clients who have a report for every platform but still cannot say whether last month's spend filled tables. It covers the KPIs, the data sources, a worked cost-per-order example, a multi-location layout and the mistakes that make restaurant reports misleading.
Quick answer
What should a restaurant marketing dashboard include?
A restaurant marketing dashboard should show reservations, online orders and sales by channel and location, Google Business Profile actions such as calls, direction requests, menu clicks and bookings, ad spend and cost per order, email and SMS results, and delivery app orders after commission. Sales come from the POS and ordering platforms; marketing data from GA4, ads and Google Business Profile.
- Judge channels on orders, covers and sales after commission, not on clicks or followers.
- Google Business Profile is a primary channel for restaurants; report calls, directions, menu clicks and bookings per location.
- POS, reservation and delivery app data rarely have native Data Studio connectors; land them in Sheets or BigQuery.
- Give every source a location key so a group can compare sites on the same page.
What is a restaurant marketing dashboard?
It is one live report that follows a diner from an ad, a map listing, a social post or an email to a reservation, an online order or a visit, and puts the cost of winning that diner next to what they spent. Platform reports stop at the click or the impression. A restaurant marketing dashboard keeps going to the POS, because that is where the money is counted.
The pages ranking for this topic today are mostly reporting tool templates and restaurant software product pages. The best-known template lists four KPIs: table reservations, channel performance, reservation value from organic search, and new versus returning visitors. Those belong in the report, but they leave out point of sale data, online ordering, third-party delivery, multi-location comparison and the cost side. Those gaps decide whether an owner trusts the numbers.
In Data Studio (formerly Looker Studio), we build restaurant marketing dashboards from native connectors for GA4, Google Ads and Search Console, partner connectors for Meta, TikTok and Google Business Profile, and scheduled exports from the POS, reservation system and delivery platforms landed in Google Sheets or BigQuery.
Why do restaurants need a different marketing report?
Because most restaurant revenue never touches a website checkout. A diner may see an Instagram reel, search the restaurant's name on Google Maps, tap call, and pay at the table. Another orders through a delivery app that keeps part of the bill. A generic digital marketing report built around website conversions misses most of that.
Diner behavior makes the local and social channels hard to ignore. TouchBistro's 2025 Diner Trends Report found that 67% of Gen Z and Millennial diners use social media to decide on a restaurant, 45% of diners look for a restaurant's business profile on Facebook, and 41% had checked a restaurant's Google reviews in the previous three months. Its 2026 State of Restaurants Report found that 81% of operators saw takeout and delivery sales rise compared with the previous year. A useful report has to cover maps, social, ordering and delivery, not only the website.
Which KPIs belong on a restaurant marketing dashboard?
Group KPIs by stage: reach, local intent, website and ordering, sales, and retention. Each stage has its own source, and a drop between two stages points to a different fix. Many direction requests but flat covers suggests a problem at the door, such as wait times or opening hours. Many menu clicks but few online orders points to the ordering flow or prices.
| Stage | KPI | Usual source |
|---|---|---|
| Reach | Impressions, clicks, spend and video views by campaign | Google Ads; Meta and TikTok through partner connectors |
| Local intent | Profile views on Maps and Search, calls, direction requests, website clicks, menu clicks | Google Business Profile through a partner connector or API |
| Local intent | Reserve with Google bookings, review count and average rating | Google Business Profile; review exports |
| Website and ordering | Sessions by channel, menu page views, online order starts and completed orders | GA4 on the website and first-party ordering pages |
| Sales | Covers, orders, net sales and average check by location and channel | POS exports, aggregated by day |
| Sales | Delivery app orders, gross sales, commission and net sales | Delivery platform reports or merchant exports |
| Retention | Email and SMS orders, loyalty sign-ups, repeat guest share | Email or SMS platform, loyalty program, POS |
| Cost | Ad spend, commission, cost per order and cost per cover | Calculated in Sheets or BigQuery |
How do you report Google Business Profile for restaurants?
Treat Google Business Profile as a channel of its own, with a row per location per day. Google's Business Profile Performance API lists the daily metrics available: impressions split by Maps and Search on desktop and mobile, call clicks, direction requests, website clicks, messaging clicks, bookings made through Reserve with Google, and menu clicks, where repeated clicks by one user in a day count once.
Two details matter for restaurants. First, the food orders metric is marked as deprecated in Google's API reference, so older reports that relied on it will show gaps; track orders in your ordering platform instead. Second, Business Profile impressions count one per unique user per day, so they are not comparable with ad impressions. Show them on their own chart rather than summing them into a total reach figure.
Data Studio has no native Business Profile connector. Agencies usually use a partner connector or a scheduled API pull into BigQuery, which also keeps history beyond what the Business Profile interface shows.
- Calls and direction requests: the strongest signals of a visit from a map listing.
- Menu clicks: interest in the menu, useful to compare with online order starts.
- Bookings: reservations made through Reserve with Google, reported per location.
- Website clicks: should line up with GA4 sessions tagged with UTM parameters on the profile link.
Where does restaurant sales data come from?
Sales live in systems that Data Studio does not connect to natively. Data Studio's native connectors cover Google products, Sheets, BigQuery and SQL databases such as MySQL, PostgreSQL and SQL Server, not restaurant POS, reservation or delivery platforms. Partner connectors exist for some, but coverage varies by vendor and changes often, so check before you plan around one.
The reliable pattern is a daily summary table. Export or pull sales from the POS by day, location and order type (dine-in, takeout, first-party delivery, third-party delivery), add reservation counts from the booking system, and add delivery platform orders and commission from merchant reports. Land them in Google Sheets for one or two sites, or BigQuery for a group. Data Studio then reads that table alongside GA4, ads and Business Profile data.
Keep guest names, phone numbers and emails out of it. Aggregated counts and sales by day, location and channel answer every marketing question, and leaving personal data out keeps the dashboard simpler to share and to secure.
Worked example: cost per order across channels
Take a hypothetical two-location restaurant over one month. These figures are illustrative, not benchmarks, and the delivery commission rate is an assumption; use the rate in your own merchant agreement.
Meta ads cost $2,000 and promote first-party online ordering. GA4 and the ordering platform credit them with 250 orders at a $32 average, or $8,000 in sales. Cost per order is $8, and marketing cost is 25% of the sales it produced. Google Ads cost $1,500 and drive 300 calls and 900 direction requests, which cannot be tied to a ticket directly, so the dashboard shows cost per call ($5) and cost per direction request (about $1.67) and watches covers at each location against those trends.
Third-party delivery brings 600 orders at a $30 average, $18,000 in gross sales. At an assumed 20% commission that is $3,600, or $6 per order, and net sales of $14,400. Email costs $150 for the platform and brings 120 orders from past guests, about $1.25 per order.
A report showing only ad spend would rank delivery as free and Meta as expensive. On cost per order, Meta ($8) costs more than delivery ($6), but each first-party order keeps the guest's details for email, which then produces repeat orders at around $1.25. That is the trade-off an owner needs to see, and it only appears when ad spend, commission and sales sit in the same table with shared date, location and channel keys.
In Data Studio, cost per order is a calculated field, (SUM(ad_spend) + SUM(commission) + SUM(platform_fees)) / SUM(orders), on that daily table. Build the table outside a blend; blends join at most 5 sources with equality joins only, and a restaurant with ads, Business Profile, GA4, a POS and a delivery platform reaches that limit at once.
How should a multi-location restaurant dashboard be laid out?
Five or six pages cover most restaurant groups. Each page answers one question, and the summary answers the one the owner asks first. Put a date control and a location filter on every page so managers can compare sites, and show week-on-week as well as month-on-month, because restaurant demand swings by day of week and season.
Franchise brands add a page that ranks locations by covers, sales growth and local marketing spend, so the brand team can see which franchisees need help. Agencies with several restaurant clients should build this once as a master template with identical field names, copy it per client and swap data sources. Our white-label reporting service does this under the agency's own brand.
- Summary: sales, orders and covers by channel and location, cost per order, against last period and target.
- Paid media: Google Ads, Meta and TikTok spend, clicks and attributed online orders.
- Local: Business Profile calls, direction requests, menu clicks, bookings and ratings by location.
- Ordering and delivery: first-party orders versus delivery app orders, commission and net sales.
- Retention: email and SMS orders, loyalty sign-ups and repeat guest share.
- Location ranking: every site side by side on the same KPIs.
What mistakes make restaurant marketing reports misleading?
Most misleading restaurant reports are not wrong in any single number. They stop at engagement, leave out commission, or mix locations. These are the problems we look for first.
- Reporting followers, likes and impressions with no link to orders, covers or sales.
- Showing delivery app gross sales without commission, so delivery looks like the cheapest channel.
- Adding Business Profile impressions to ad impressions, although they are counted differently.
- Leaving UTM parameters off the Business Profile website link, so map traffic shows as direct in GA4.
- Relying on the deprecated Business Profile food orders metric instead of ordering platform data.
- Mixing locations without a location key, so a strong site hides a weak one.
- Comparing a holiday week to an ordinary week without a same-period-last-year view.
Should a restaurant build its own marketing dashboard or hire help?
Build it yourself if you run one location, your POS already reports sales by order type, and you are happy to update a monthly sheet of delivery orders and commission by hand. A one-page summary with orders and cost per order by channel will already beat most generic templates.
Bring in help when you run several locations or a franchise system, report for many restaurant clients as an agency, need POS, reservation and delivery data joined automatically every day, or need history in BigQuery so year-on-year comparisons stay fast.
We are not the right fit if you want a restaurant POS, a loyalty app or an online ordering system. Those are specialist restaurant products. We build custom Data Studio dashboards that the restaurant or agency owns, on top of the systems you already use.
How Greenwolf Tech Labs builds restaurant marketing dashboards
We start with a free review of your channels, POS and delivery exports, reservation data, Business Profile locations and GA4 setup. Then we agree definitions such as cost per order and repeat guest share, build the data layer in Sheets or BigQuery, design the pages above in Data Studio, and reconcile sales totals against the POS before handover.
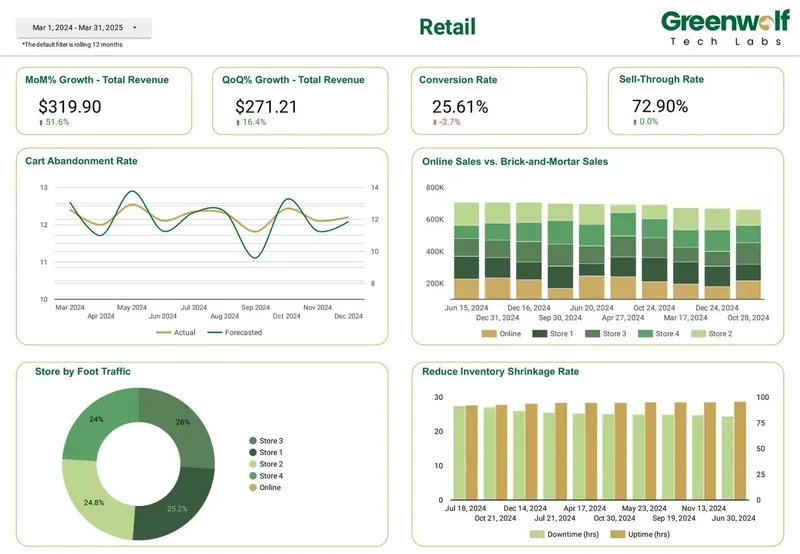
Our team has delivered 100+ projects for 200+ clients and has built Data Studio dashboards for retail, including online versus in-store sales, conversion rate and revenue growth against forecast, and multi-channel marketing dashboards covering spend, leads and return across Google Ads, Meta, LinkedIn, GA4 and Search Console. We quote a fixed price after the review, and everything we build sits in accounts you own.
FAQ
Frequently asked questions
What KPIs should a restaurant marketing team track?
Track orders, covers and net sales by channel and location, cost per order including ad spend and delivery commission, and Google Business Profile calls, direction requests, menu clicks and bookings. Add email and SMS orders and repeat guest share to see whether marketing builds regulars, not only first visits.
How do I measure whether restaurant ads bring in diners?
For online orders, track the order in GA4 or the ordering platform with UTM-tagged links. For dine-in, watch calls, direction requests and bookings from ads and Business Profile, and compare covers by location against spend over several weeks. No single metric proves a walk-in came from an ad, so look for consistent movement.
Can Data Studio connect to a restaurant POS like Toast or Square?
Not natively. The usual route is a scheduled export or API pull from the POS into Google Sheets or BigQuery, summarized by day, location and order type. Data Studio then reads that table alongside GA4 and ad data. Some partner connectors exist, so check current coverage with the vendor.
How do I include DoorDash or Uber Eats orders in a marketing report?
Export orders, gross sales and commission from the merchant reports by day and location, then load them into the same summary table as POS and ad data. Report net sales after commission next to gross, so delivery is compared fairly with first-party ordering.
Which Google Business Profile metrics matter most for restaurants?
Calls, direction requests, menu clicks and Reserve with Google bookings show intent to visit or order. Website clicks matter if you tag the profile link with UTM parameters. Google's API marks the food orders metric as deprecated, so track orders in your ordering platform instead.
Can one dashboard cover all our restaurant locations?
Yes. Give every source a location field, add a location filter to every page and keep both per-site and group totals. A location ranking page then shows which sites are growing and which need local marketing support.
Do restaurant managers need a paid licence to view the dashboard?
No. Data Studio is free for creators and viewers. Data Studio Pro costs $9 per user per project per month and only applies to creators, editors and managers in Pro workspaces, so managers who only view the report never need one.
Keep reading
Related pages
Get started
Tell us what your reporting has to do
Describe the dashboards you need, who reads them and where the data sits. We reply within one business day with an approach, the connectors involved and a fixed-price plan.
- Free 30-minute reporting review
- Fixed quote before any work starts
- Everything built and owned in your Google account
Prefer email? info@greenwolftechlabs.com
Get a free proposal
Two lines is enough to start.